

Maintenance KPI Dashboard: The 12 Metrics Worth Tracking
(and 5 That Aren't)
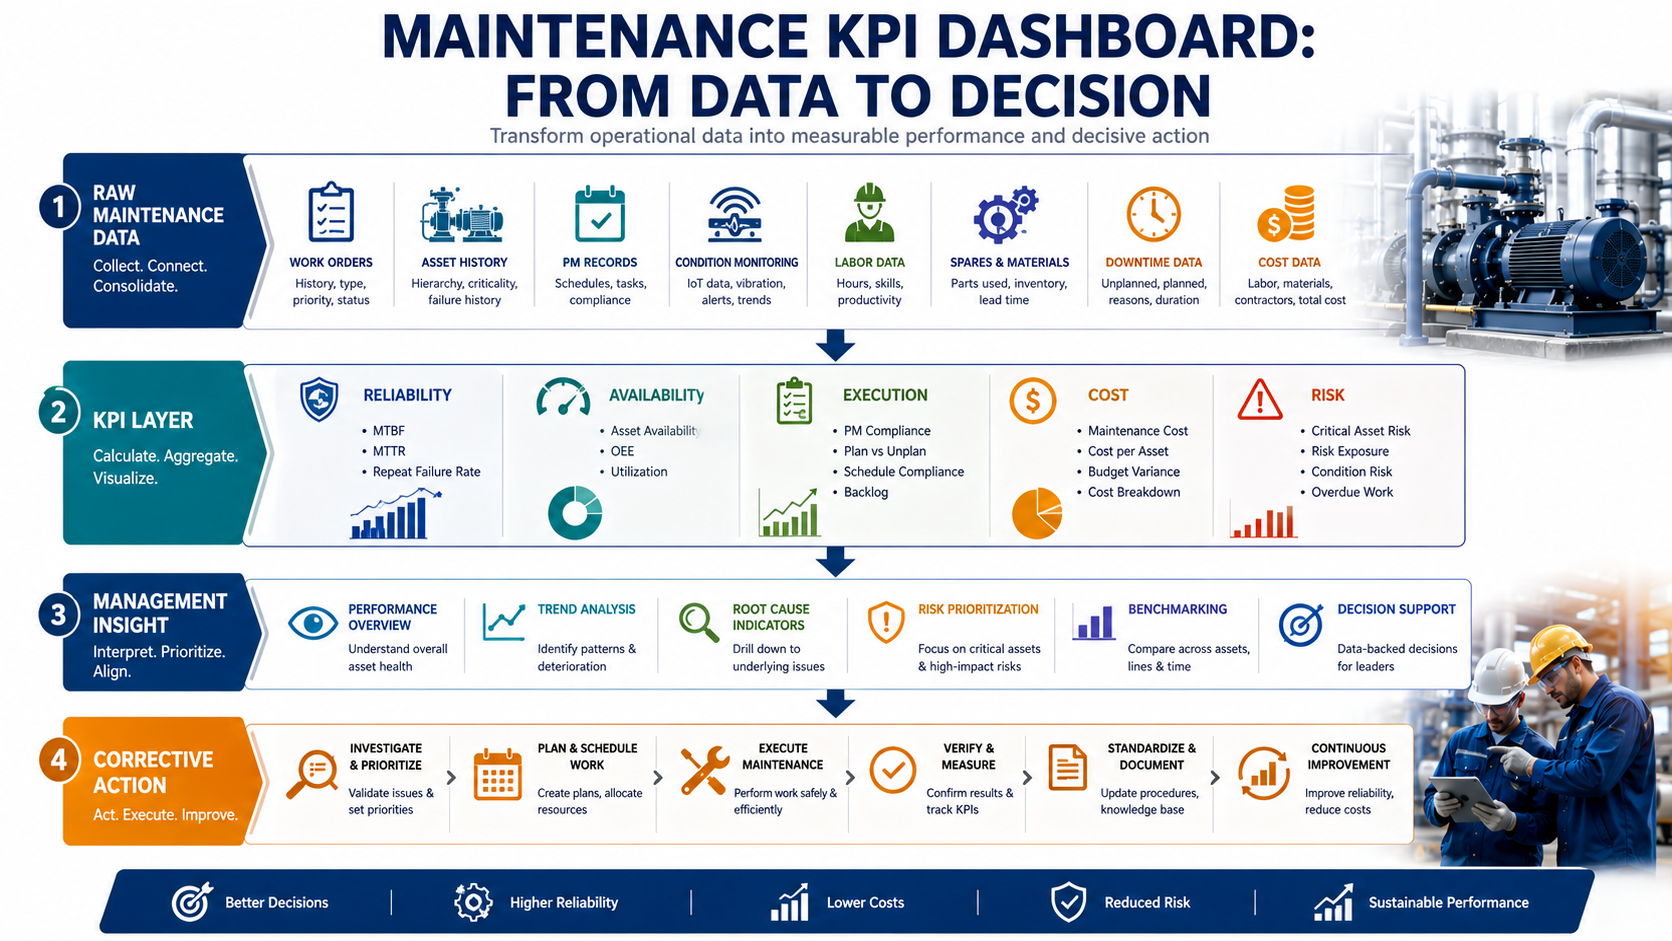
A maintenance KPI dashboard should do more than display numbers. It should tell a plant manager whether equipment is becoming more reliable, whether maintenance is becoming more proactive, whether the team can execute planned work, and whether the money being spent is producing measurable asset performance.
That distinction matters because maintenance organizations can easily become data-rich and decision-poor. A dashboard may contain dozens of charts, hundreds of work-order records, and a long list of percentages while still failing to answer the questions leadership actually cares about: Are our critical assets reliable? Are we preventing failures? Are we executing the right work? Is downtime falling? Is maintenance cost under control?
The strongest maintenance KPI dashboards therefore do not attempt to measure everything. They create a focused performance system around a small number of metrics that connect maintenance activity to business outcomes.
This article identifies the 12 maintenance KPIs worth tracking, explains what each metric actually tells decision-makers, and identifies five commonly tracked metrics that should not occupy prime dashboard real estate. The objective is not to build a prettier dashboard. It is to build a maintenance performance system that drives better decisions.
What Is a Maintenance KPI Dashboard?
A maintenance KPI dashboard is a structured visual view of maintenance performance that brings reliability, availability, work execution, cost, and asset-performance indicators into one decision-making environment.
The important word is decision-making.
A KPI becomes valuable when a change in its value causes someone to investigate, prioritize, allocate resources, revise a maintenance strategy, or take corrective action. A dashboard that simply reports historical numbers without triggering decisions is closer to a reporting screen than a management system.
Modern maintenance organizations increasingly use KPI dashboards to connect work-order history, asset performance, preventive maintenance, condition monitoring, cost information, and operational data. Maintenance KPIs can provide management visibility into core maintenance processes while supporting a shift from reactive maintenance toward more proactive asset-management strategies.
The strategic question should therefore be:
“What decision should this KPI help us make?”
If the answer is unclear, the metric probably does not deserve prominent dashboard placement.
Why Most Maintenance KPI Dashboards Track Too Much
The problem with excessive KPI reporting is not the availability of data. Modern CMMS, EAM, IoT, ERP, and condition-monitoring systems can generate enormous quantities of operational information.
The problem is signal-to-noise ratio.
When a dashboard shows 25 or 40 metrics with equal visual importance, users must mentally determine which numbers actually matter. Critical deterioration can become buried beneath administrative statistics.
A plant manager typically needs a very different dashboard from a maintenance planner.
A reliability engineer may want failure-mode trends, MTBF by asset class, repeat failures, and condition indicators. A planner may care more about backlog age, schedule attainment, labor availability, and material readiness. A CFO may focus on maintenance cost, budget variance, asset lifecycle cost, and production impact.
That means a mature maintenance KPI architecture should have layers:
- Executive layer — business and asset outcomes.
- Maintenance management layer — reliability, execution, cost, and compliance.
- Planner/supervisor layer — backlog, scheduling, resources, and work quality.
- Reliability layer — failure patterns, condition indicators, and asset-level trends.
- Diagnostic layer — individual work orders, failure codes, parts, labor, and technician observations.
The dashboard should not attempt to put every layer on one screen.
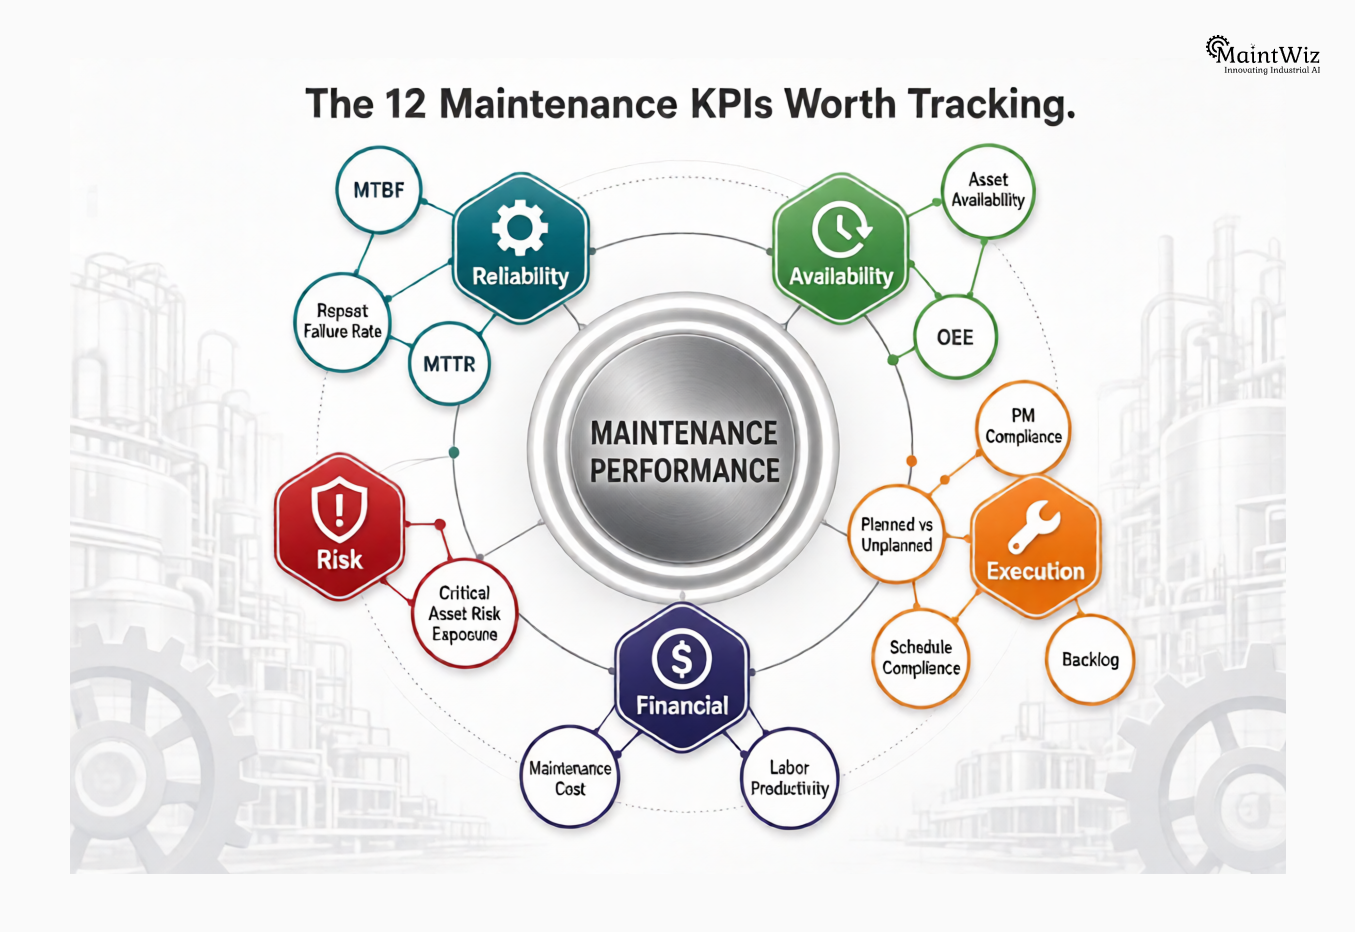
The 12 Maintenance KPIs Worth Tracking
The following 12 metrics form a practical performance architecture covering reliability, availability, work execution, maintenance effectiveness, operational performance, and financial control.
1. Mean Time Between Failures (MTBF)
MTBF = Total operating time ÷ Number of failures
MTBF is one of the most important reliability indicators because it measures how long an asset operates between failures.
But the real value is not the number itself. The trend matters more.
If a critical pump’s MTBF increases from 800 hours to 1,200 hours, the organization has evidence that reliability is improving. If it falls from 1,200 hours to 700 hours, the maintenance strategy needs investigation.
A declining MTBF can indicate deteriorating equipment condition, ineffective preventive-maintenance tasks, incorrect maintenance intervals, poor installation, operating-condition changes, recurring failure modes, or aging assets.
For this reason, MTBF should never be viewed only as a plant-wide average. Segment it by critical asset, equipment class, failure mode, production line, and time period where data quality permits.
The strategic question is:
“Which assets are becoming less reliable, and why?”
How to make MTBF actionable
Do not stop at reporting the average. Pair MTBF with:
- Asset criticality
- Failure mode
- Repeat failure history
- Maintenance strategy
- Operating hours
- Condition-monitoring data
- Corrective-action history
A dashboard should make it possible to move from “MTBF declined” to “these three critical assets experienced recurring bearing failures.”
That is where a KPI becomes operational intelligence.
2. Mean Time to Repair (MTTR)
MTTR = Total repair time ÷ Number of repairs
MTTR measures how quickly the maintenance organization restores equipment after a failure.
MTBF tells you about failure frequency.
MTTR tells you about recovery capability.
A plant can have excellent preventive maintenance and still suffer substantial production losses if failed equipment takes too long to restore.
High MTTR can be caused by poor troubleshooting, lack of spare parts, inadequate procedures, access constraints, skill gaps, contractor delays, permit requirements, poor job planning, or equipment design.
Therefore, MTTR should not become a simple technician-performance score.
The better management question is:
“What is preventing us from restoring this asset faster?”
Break MTTR into meaningful components where possible:
Detection → Diagnosis → Preparation → Repair → Testing → Return to service
This distinction can reveal that the physical repair takes only two hours while the asset remains unavailable for another eight hours because parts, permits, or specialist support were not ready.
3. Asset Availability
Availability answers a fundamental plant question:
“How much of the required operating time was the asset actually available?”
A simplified availability calculation is:
Availability = Uptime ÷ (Uptime + Downtime) × 100
Availability is particularly valuable for critical production assets because it connects maintenance performance directly with operational capacity.
However, organizations should be careful with aggregate availability. A plant can report 98% average availability while one strategically critical compressor operates at 82%.
The dashboard should therefore distinguish:
- Plant availability
- Production-line availability
- Critical-asset availability
- Mechanical availability
- Maintenance-related downtime
This makes availability a management metric rather than merely a percentage on a screen.
4. Preventive Maintenance Compliance
PM Compliance = PM tasks completed on time ÷ PM tasks due × 100
Preventive maintenance compliance is a leading indicator because it measures whether the organization is executing planned maintenance as intended.
A low PM compliance rate can indicate:
- Excessive reactive work
- Poor scheduling
- Insufficient manpower
- Material shortages
- Production conflicts
- Unrealistic maintenance intervals
- Weak planning discipline
But 100% PM compliance is not automatically a sign of maintenance excellence.
If technicians complete every PM task but the tasks themselves do not address actual failure modes, the organization may simply be executing an ineffective program perfectly.
Therefore, PM compliance should be interpreted alongside failure trends, MTBF, repeat failures, and asset criticality.
MaintWiz, for example, supports automated preventive-maintenance scheduling, work-order generation, prioritization, digital procedures, and KPI visibility, allowing PM execution to be connected with broader maintenance performance.
5. Planned vs. Unplanned Maintenance Ratio
A healthy maintenance organization should understand how much effort is being consumed by planned work versus reactive work.
The exact target varies by asset base, industry, maturity, and operating environment. The important point is the direction of travel.
If unplanned work is consistently increasing, maintenance capacity is being consumed by firefighting.
That creates a destructive cycle:
More failures → more reactive work → less planned work → deferred maintenance → greater failure exposure → more reactive work
The dashboard should therefore show the relationship between planned and unplanned work over time.
More importantly, management should investigate what is driving the unplanned portion.
The objective is not simply to make the percentage look better. It is to reduce avoidable reactive demand.
6. Maintenance Schedule Compliance
Schedule compliance measures whether planned maintenance work is completed according to the established schedule.
It answers:
“Can our maintenance organization execute the work it commits to?”
This is different from PM compliance.
PM compliance focuses specifically on preventive tasks.
Schedule compliance looks more broadly at planned maintenance execution.
Low schedule compliance can expose problems with:
- Planning quality
- Work-order readiness
- Resource availability
- Production coordination
- Material availability
- Emergency work
- Contractor management
- Priority control
A useful dashboard should allow managers to investigate why planned work was not completed, rather than merely displaying a red percentage.
7. Maintenance Backlog
Backlog represents maintenance work that has been identified but not yet completed.
Backlog is one of the most useful indicators of future workload and maintenance capacity.
But total backlog alone can be misleading.
A backlog of 1,000 hours is not necessarily dangerous if most tasks are low-criticality work. Conversely, a backlog of only 100 hours may be highly concerning if it contains overdue work on safety-critical or production-critical equipment.
Therefore, mature dashboards should segment backlog by:
- Asset criticality
- Age
- Work priority
- Maintenance type
- Estimated labor hours
- Material readiness
- Safety relevance
The important management question becomes:
“What portion of our backlog represents unacceptable risk?”
8. Repeat Failure Rate
Repeat failure rate is a powerful indicator of maintenance effectiveness because it measures whether the organization is actually eliminating recurring problems.
A breakdown that returns after a repair is not simply another work order. It may be evidence that the underlying failure mechanism was never addressed.
Repeat failures can originate from:
- Incorrect diagnosis
- Temporary repairs
- Poor-quality workmanship
- Incorrect spare parts
- Inadequate job plans
- Weak root-cause analysis
- Poor operating practices
- Inappropriate PM strategy
Tracking repeat failure rate shifts the conversation from “How much work did we complete?” to “Did the work actually solve the problem?”
That is a much more valuable maintenance question.
9. Overall Equipment Effectiveness (OEE)
OEE combines three dimensions:
Availability × Performance × Quality
It is especially useful when maintenance leaders need to understand how equipment condition affects production performance.
However, OEE should not be treated as a maintenance KPI in isolation.
A low OEE value may originate from maintenance-related downtime, but it may also result from production speed losses or quality losses.
This is why OEE works best as a cross-functional KPI connecting maintenance, operations, engineering, and quality.
The maintenance dashboard should help answer:
“How much of our OEE loss is actually maintenance-driven?”
That is more useful than simply reporting an OEE percentage.
MaintWiz’s KPI capabilities include OEE alongside availability, MTBF, MTTR, utilization, and other maintenance-performance indicators.
10. Maintenance Cost
Maintenance cost is where reliability strategy meets financial reality.
A meaningful maintenance-cost view should go beyond total monthly spending.
Track cost through multiple lenses:
- Maintenance cost per asset
- Maintenance cost by maintenance type
- Labor cost
- Spare-parts cost
- Contractor cost
- Emergency-maintenance cost
- Cost by production unit
- Planned vs. actual cost
- Lifecycle maintenance cost
A rising maintenance budget is not automatically bad.
If additional maintenance expenditure increases availability, extends asset life, and prevents major failures, it may represent a high-return investment.
The real question is:
“What operational and reliability outcome are we purchasing with maintenance expenditure?”
This is why cost must be connected to asset performance rather than viewed independently.
MaintWiz provides maintenance-budget capabilities covering cost tracking, forecasting, reporting, and financial-system integration, supporting a more integrated view of maintenance economics.
11. Maintenance Labor Productivity
Labor is one of the largest controllable resources in maintenance.
But labor productivity should not be reduced to “hours worked per technician.”
The more useful perspective is how effectively available labor capacity is converted into productive maintenance execution.
Relevant dimensions include:
- Planned labor hours
- Actual labor hours
- Emergency labor
- Waiting time
- Travel time
- Rework
- Contractor utilization
- Skill availability
- Work-order completion
This metric should be interpreted carefully because maximizing technician utilization can create the wrong behavior.
A technician who is continuously occupied is not necessarily productive if they are working on low-value tasks while critical assets deteriorate.
The objective should be productive capacity directed toward the highest-value maintenance work.
12. Maintenance KPI: Critical Asset Risk Exposure
This is the metric many traditional dashboards overlook.
Reliability is not only about averages.
A plant may have excellent overall MTBF and availability while still carrying significant risk on a small number of critical assets.
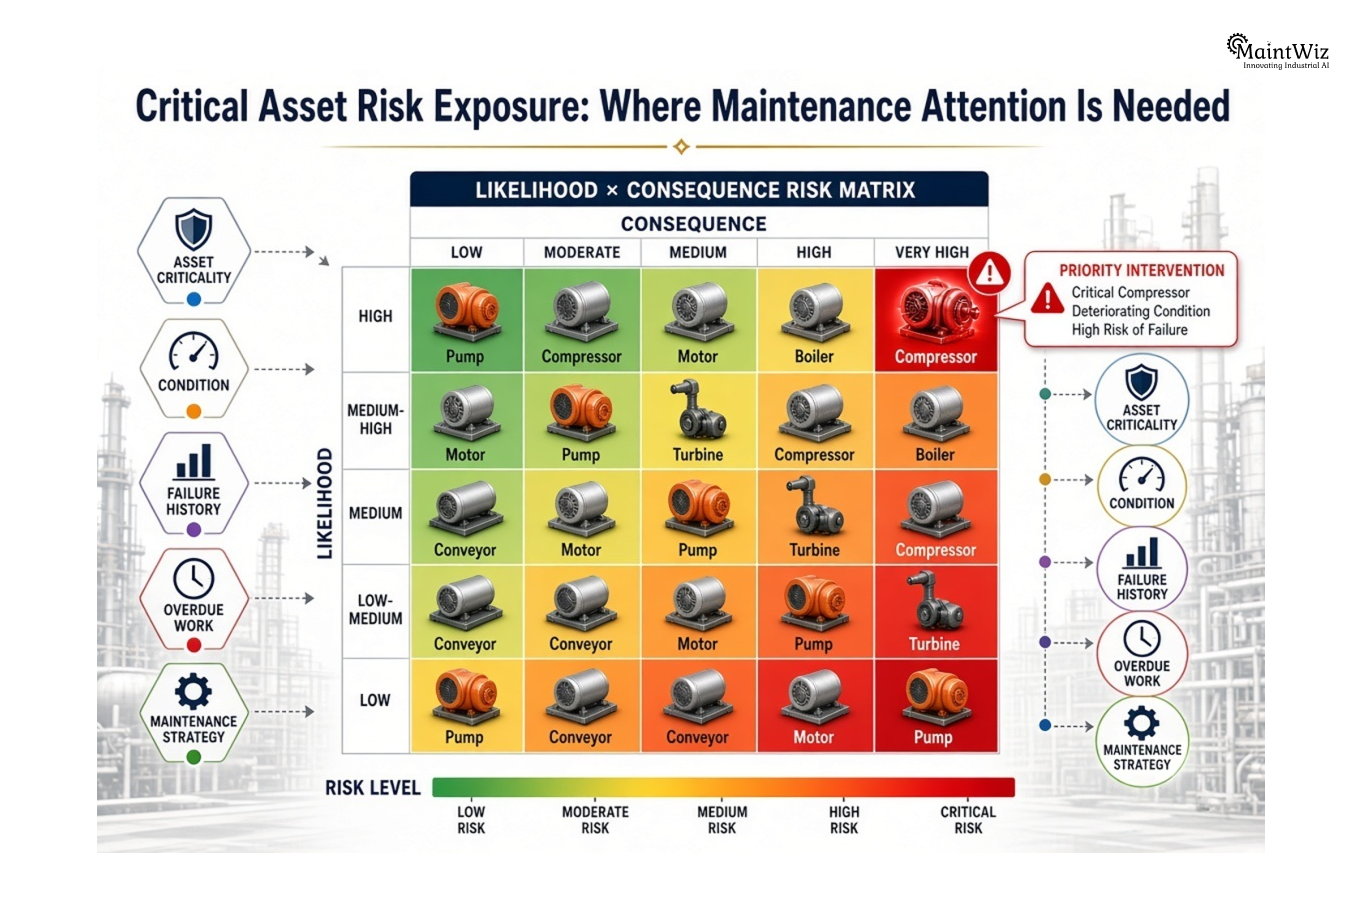
A useful management view combines:
Asset criticality + condition + failure history + overdue work + maintenance strategy
The resulting risk picture helps leaders identify where maintenance attention is most urgently required.
For example, a critical compressor with deteriorating condition, repeated failures, overdue inspections, and unavailable spare parts should receive far more management attention than ten low-criticality assets with minor backlog.
This transforms the dashboard from a performance-reporting system into a risk-prioritization system.
The 5 Maintenance Metrics That Aren't Worth Prime Dashboard Space
The following metrics are not necessarily useless.
They can be valuable for supervisors, planners, reliability engineers, or operational diagnostics.
The problem is that they are frequently promoted to executive-level KPIs without demonstrating a direct connection to business outcomes.
1. Total Number of Work Orders Closed
Closing 500 work orders is not necessarily better than closing 300.
The organization may simply be processing more low-value work.
A high work-order closure count can even hide poor maintenance performance if the team is repeatedly repairing the same assets.
Use work-order volume as a diagnostic measure, not a headline performance KPI.
2. Number of Preventive Maintenance Tasks Completed
The number of PM tasks completed tells you activity volume.
It does not tell you whether the PM program is effective.
Completing 10,000 inspections does not matter if critical failures continue to occur.
PM volume should therefore be subordinate to:
PM compliance → failure trends → repeat failures → reliability improvement
The goal is not more maintenance.
The goal is better maintenance.
3. Number of Maintenance Alerts Generated
Modern IoT and condition-monitoring systems can generate large numbers of alerts.
More alerts do not necessarily mean better maintenance.
In fact, excessive alerts can create alert fatigue and distract technicians from genuinely important conditions.
Track the quality and outcome of alerts, not simply the number generated.
A better question is:
How many actionable alerts resulted in verified intervention or prevented failure?
MaintWiz’s condition-monitoring capabilities connect real-time asset data with alerts, historical analysis, and proactive maintenance workflows, making the resulting intervention more meaningful than simply counting alerts.
4. Raw Technician Utilization Percentage
Technician utilization can be useful, but it is dangerous as a standalone management KPI.
If technicians are measured primarily on being busy, the organization can unintentionally reward activity instead of value.
A better approach is to connect labor utilization with:
- Planned work
- Criticality
- First-time-right execution
- Rework
- Emergency work
- Skill utilization
- Asset outcomes
The question is not:
“Were technicians busy?”
It is:
“Was maintenance capacity deployed against the work that mattered most?”
5. Dashboard Views or Report Downloads
This is perhaps the clearest vanity metric.
A dashboard being opened 2,000 times does not mean maintenance performance improved.
Analytics usage can be useful for understanding adoption, but it should never be confused with operational success.
The ultimate measure of a maintenance analytics system is whether it improves decision quality and asset performance.
How to Build a Maintenance KPI Dashboard That Drives Decisions
The strongest dashboard architecture is not a collection of charts. It is a hierarchy of decisions.
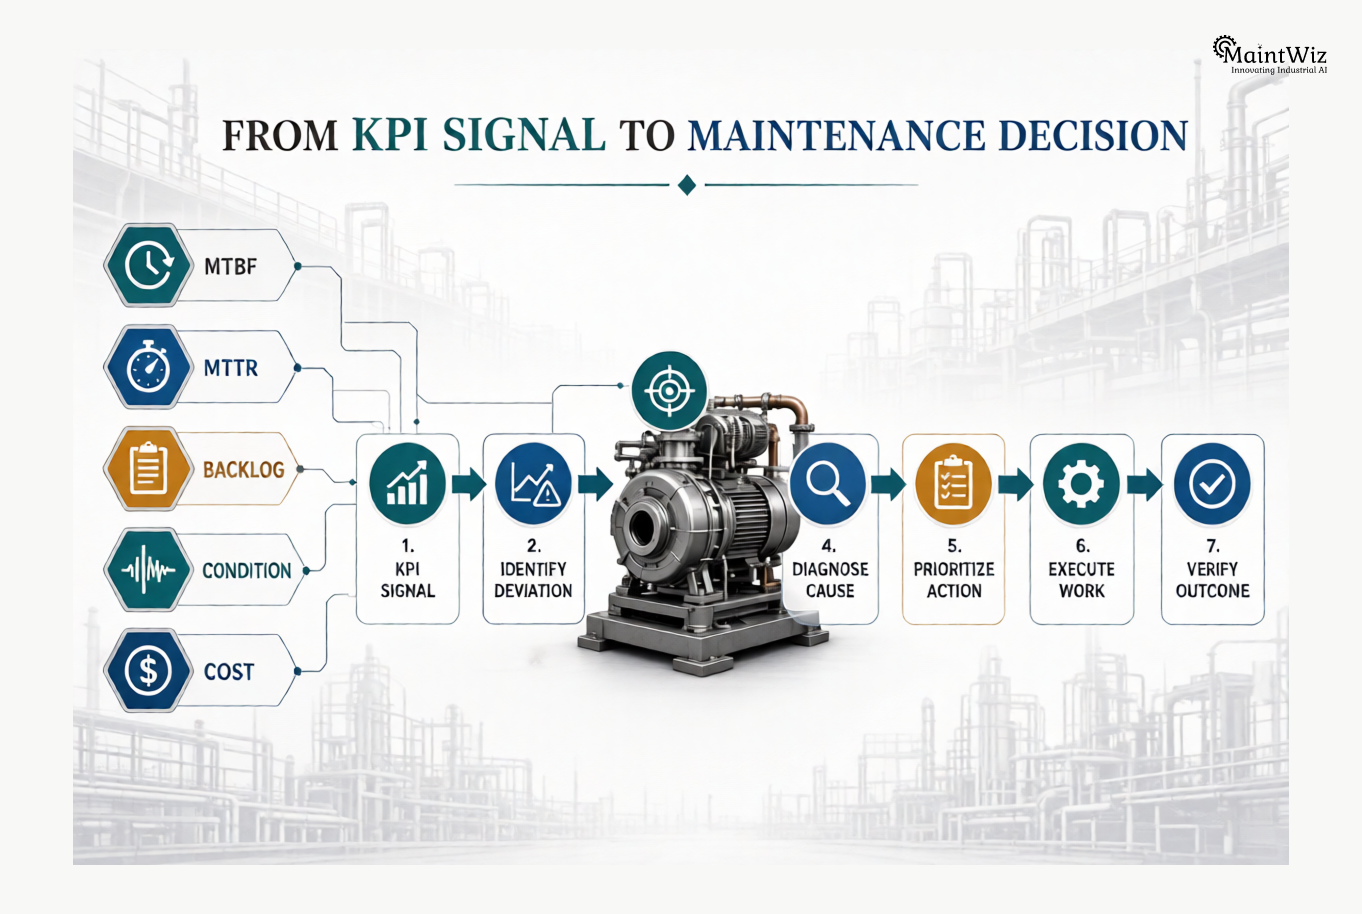
A practical structure is:
Level 1: Business Outcomes
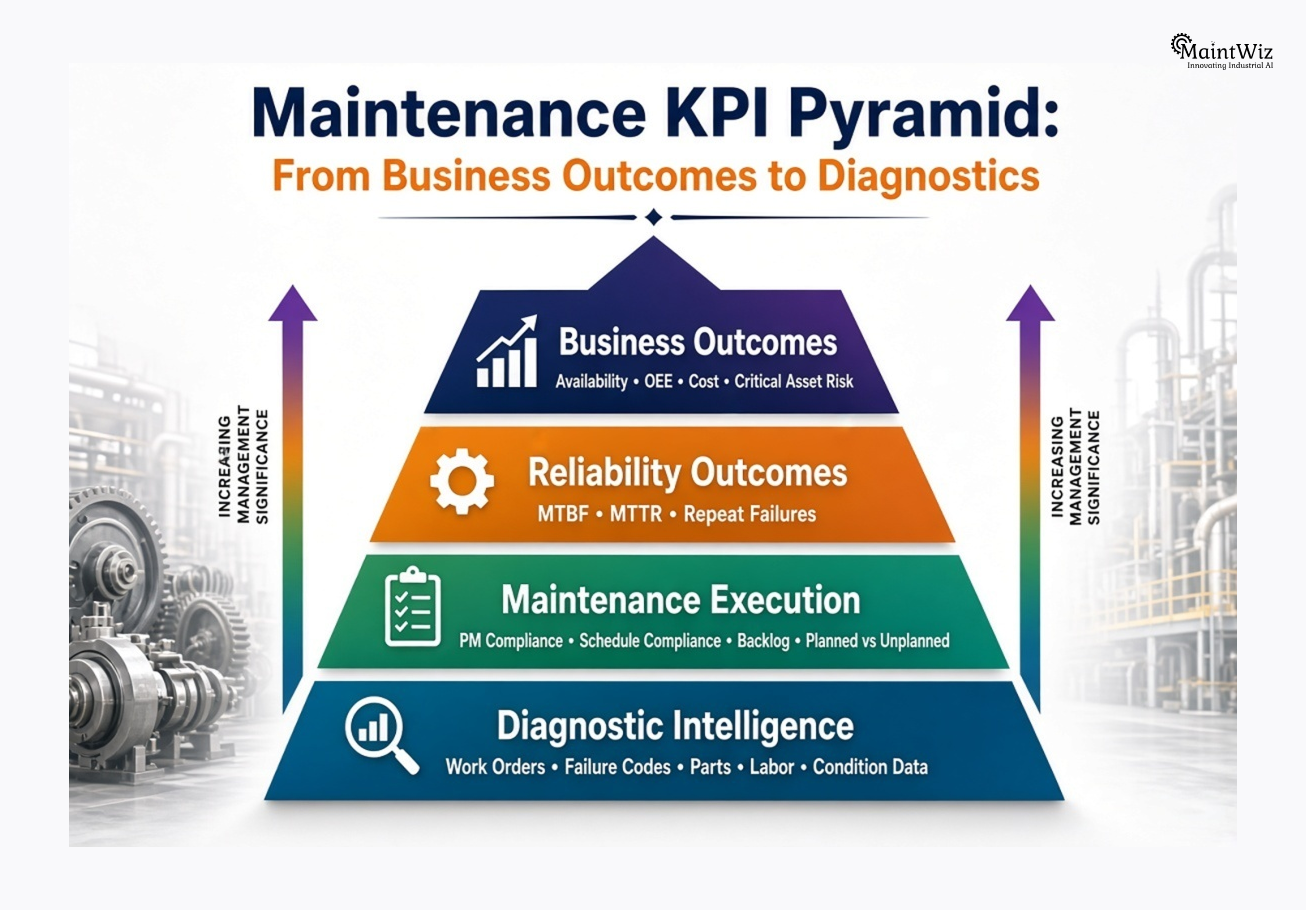
Show:
- Asset availability
- OEE
- Maintenance cost
- Critical asset risk
These tell leadership whether maintenance is influencing operational performance.
Level 2: Reliability Outcomes
Show:
- MTBF
- MTTR
- Repeat failure rate
These explain whether equipment reliability is improving.
Level 3: Maintenance Execution
Show:
- PM compliance
- Planned vs. unplanned work
- Schedule compliance
- Backlog
These explain whether the maintenance organization is executing its strategy.
Level 4: Diagnostic Intelligence
Drill down into:
- Work orders
- Failure codes
- Asset history
- Parts consumption
- Labor
- Condition data
- Failure modes
This is where teams identify root causes.
The architecture is therefore:
Outcome → Reliability → Execution → Diagnosis → Action
A good dashboard should allow users to move through that chain without losing context.
How to Connect Maintenance KPIs With Asset Management
A KPI dashboard becomes significantly more powerful when metrics are associated with individual assets rather than treated as plant-wide averages.
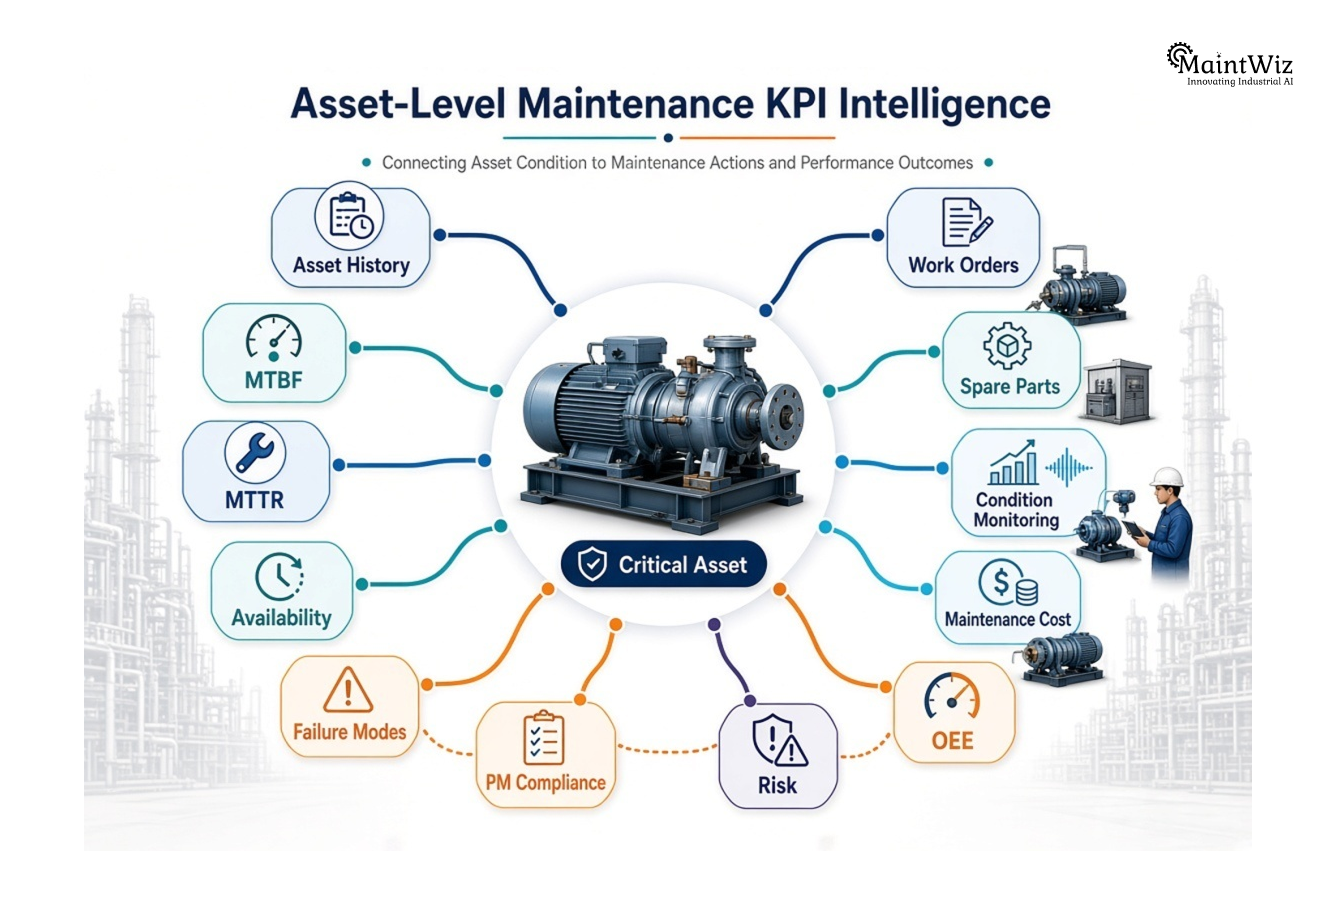
For example, an MTBF decline should immediately lead to the question:
Which assets are driving the decline?
That requires reliable asset hierarchy, equipment history, failure records, maintenance history, and lifecycle information.
Effective asset management creates the data foundation required to connect maintenance activity with asset performance. MaintWiz’s asset-management capabilities include centralized asset records, asset hierarchy, lifecycle history, traceability, and performance information, supporting this type of asset-level analysis.
How Maintenance Planning Changes the Meaning of KPI Data
KPIs should influence what the organization does next.
Suppose the dashboard shows:
- PM compliance: 96%
- MTBF: declining
- Repeat failures: increasing
- Unplanned work: increasing
A superficial interpretation might say:
“PM compliance is excellent.”
A better interpretation is:
“We are executing the existing PM program consistently, but the strategy may not be preventing the dominant failure modes.”
That insight should trigger a maintenance-strategy review.
Maintenance planning should therefore connect asset criticality, failure history, PM strategy, predictive inputs, work requirements, and resource availability. MaintWiz’s maintenance-planning functionality is designed around centralized planning, asset criticality, work-order coordination, predictive inputs, and resource management.
From KPI Insight to Work-Order Action
The most important test of a maintenance KPI dashboard is what happens after the red indicator appears.
Suppose MTBF for a critical pump falls sharply.
The dashboard should enable the reliability engineer to move from:
KPI → Asset → Failure history → Condition → Work order → Root cause → Corrective action
Without this connection, analytics remain disconnected from execution.
Work-order systems provide the operational bridge between insight and action. MaintWiz supports work-order creation, prioritization, execution, history, real-time tracking, analytics, and links between completed work and asset histories.
Why Predictive Maintenance KPIs Need a Different Mindset
Traditional maintenance reporting is heavily historical.
MTBF tells you what happened.
MTTR tells you how quickly you recovered.
Maintenance cost tells you what you spent.
But predictive maintenance introduces another question:
“What is likely to happen next?”
That requires integrating condition data, sensor information, asset history, anomaly detection, and predictive models.
MaintWiz supports integration with IoT, PLC, SCADA, and MES data and uses predictive analytics and machine-learning capabilities to support proactive maintenance decisions.
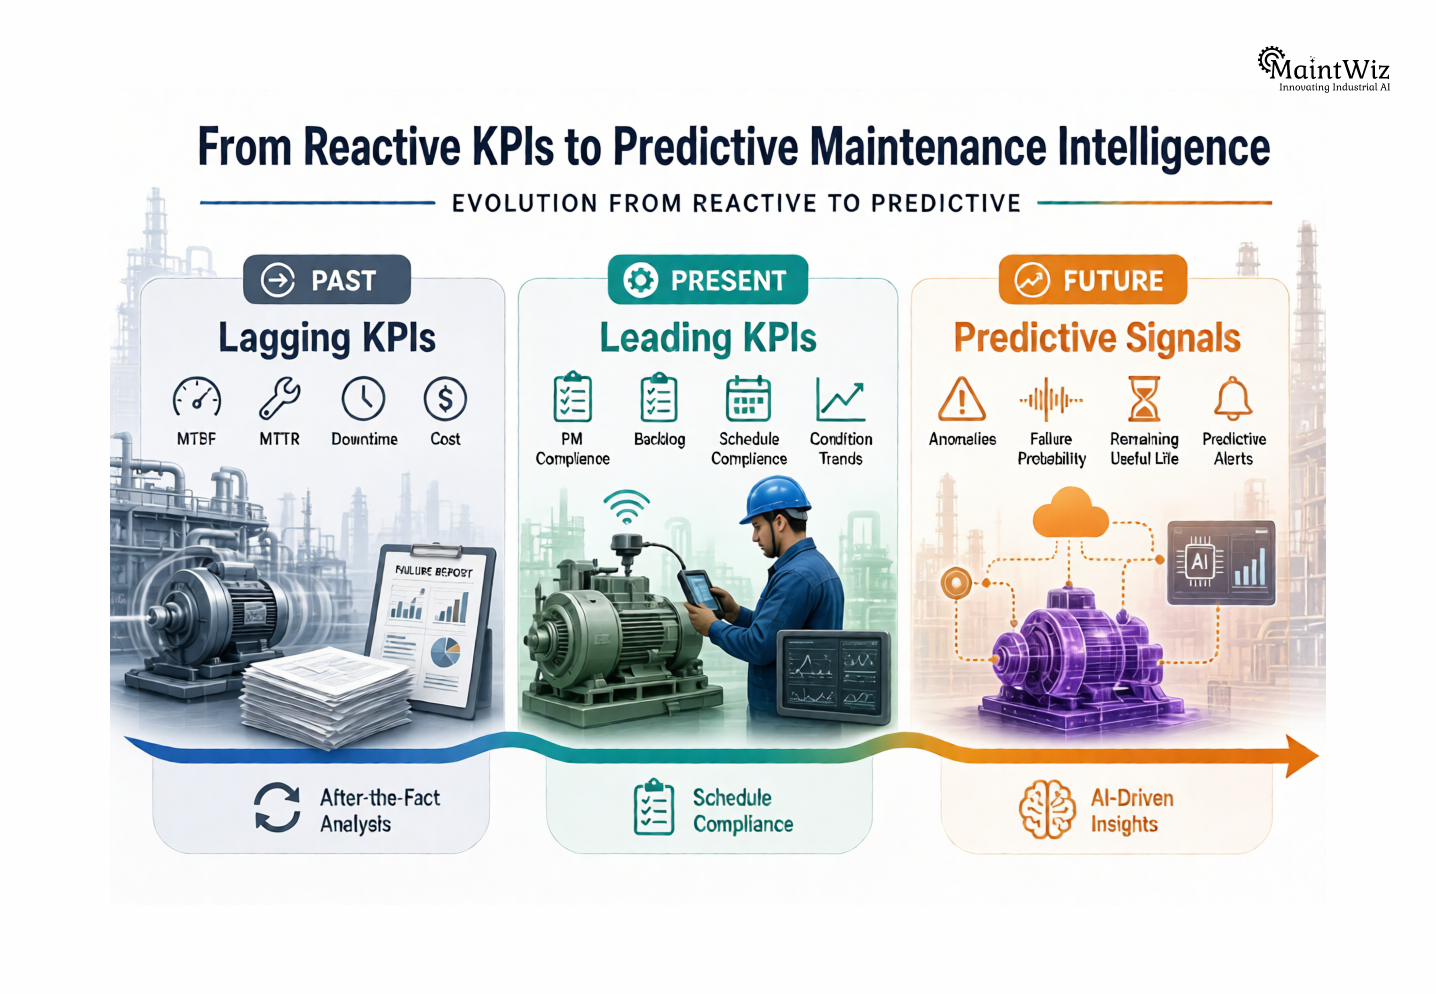
This changes the KPI architecture from purely retrospective reporting toward a combination of:
Lagging indicators + leading indicators + predictive signals
That is where the maintenance KPI dashboard becomes a strategic asset rather than a monthly reporting tool.
The Role of Condition Monitoring in a KPI Dashboard
Condition monitoring provides another layer of intelligence.
Consider a rotating asset where MTBF has not yet deteriorated significantly. However, vibration has started trending upward.
A traditional KPI dashboard may still show acceptable reliability.
A condition-aware dashboard can identify the emerging problem before it becomes a failure.
This is the fundamental advantage of connecting maintenance KPIs with live asset-condition information.
MaintWiz’s condition-monitoring capabilities support real-time asset-health information, historical analysis, alerts, IoT integration, and proactive maintenance workflows.
How MaintWiz CMMS Supports a Modern Maintenance KPI Dashboard
A modern CMMS should not simply store maintenance records and generate reports. It should create a connected information environment in which asset data, maintenance activity, planning, condition information, and performance indicators reinforce one another.
MaintWiz’s maintenance KPI capabilities include metrics such as MTBF, MTTR, MTBR, OEE, utilization, availability, planned versus unplanned maintenance, PM compliance, repeat failures, reliability indicators, maintenance costs, budget variance, labor costs, and other operational measures. The platform also supports customizable dashboards, drill-down reporting, historical analysis, anomaly detection, AI/ML insights, and mobile KPI access.
The value is not the number of KPIs available.
The value is the ability to connect a KPI to the underlying maintenance reality.
For example:
MTBF falls → identify affected assets → inspect failure history → review condition data → raise work → execute intervention → measure subsequent reliability.
That is a closed-loop maintenance intelligence model.
MaintWiz also connects KPI tracking with preventive maintenance, predictive maintenance, work orders, asset management, planning, condition monitoring, project management, and cost management.
Why this matters for a 90-day maintenance improvement sprint
A KPI dashboard becomes especially valuable during a focused 90-day reliability or maintenance improvement sprint.
The first 30 days should establish the baseline.
The next 30 days should focus on intervention.
The final 30 days should measure whether the intervention produced a sustained improvement.
A practical sequence is:
Days 1–30: Baseline
Establish MTBF, MTTR, availability, PM compliance, backlog, planned/unplanned work, repeat failures, cost, and critical-asset risk.
Days 31–60: Intervention
Prioritize the worst-performing assets, eliminate repeat failures, correct PM weaknesses, improve planning, and address execution constraints.
Days 61–90: Verify
Compare KPI trends against the baseline, validate asset-level improvements, confirm that corrective actions are sustained, and identify the next improvement cycle.
The dashboard therefore becomes the control mechanism for the sprint, not merely its reporting output.
A Practical Maintenance KPI Dashboard Layout
A CXO-level dashboard can be structured into five visual zones.
Top Row — Plant Health
Availability | OEE | Maintenance Cost | Critical Asset Risk
This gives leadership an immediate view of business impact.
Second Row — Reliability
MTBF | MTTR | Repeat Failure Rate
This reveals whether asset reliability is improving.
Third Row — Execution
PM Compliance | Planned vs. Unplanned | Schedule Compliance | Backlog
This explains whether maintenance execution is supporting the reliability strategy.
Fourth Row — Emerging Risk
Condition Trends | Critical Alerts | Deteriorating Assets
This introduces forward-looking intelligence.
Fifth Row — Drill-Down
Asset → Failure → Work Order → Parts → Labor → Cost → Outcome
This allows teams to move from executive insight to root-cause analysis.
The dashboard should visually prioritize the first three rows and keep detailed diagnostics available through drill-down rather than displaying everything simultaneously.
The Real Test: Can the Dashboard Change a Maintenance Decision?
Before adding any metric, ask five questions:
- What decision does this KPI influence?
- Who owns that decision?
- How frequently should the KPI be reviewed?
- What threshold triggers action?
- Can the user drill down to the underlying cause?
If these questions cannot be answered, the metric probably belongs in a report—not on the primary dashboard.
This is the central principle of effective maintenance analytics:
A KPI is valuable because it changes behavior, not because it occupies space on a dashboard.
Final Takeaway: Track What Changes the Asset, Not What Fills the Screen
The best maintenance KPI dashboard is not the one with the most metrics.
It is the one that makes the organization’s most important maintenance decisions faster and more accurately.
The 12 metrics worth prioritizing are:
- MTBF
- MTTR
- Asset Availability
- PM Compliance
- Planned vs. Unplanned Maintenance
- Maintenance Schedule Compliance
- Maintenance Backlog
- Repeat Failure Rate
- OEE
- Maintenance Cost
- Maintenance Labor Productivity
- Critical Asset Risk Exposure
The five metrics that should generally not dominate the executive dashboard are:
- Total work orders closed
- Number of PM tasks completed
- Number of maintenance alerts
- Raw technician utilization
- Dashboard views/report downloads
The distinction is fundamental.
Activity metrics tell you what the maintenance organization did. Outcome metrics tell you what changed.
A mature maintenance organization needs both—but leadership attention should remain concentrated on the indicators that reveal reliability, risk, execution quality, cost, and operational performance.
That is what turns a maintenance KPI dashboard from a reporting artifact into a management system.
FAQ: Maintenance KPI Dashboard
What should be included in a maintenance KPI dashboard?
A strong maintenance KPI dashboard should include a focused combination of reliability, availability, execution, cost, and risk indicators. Core metrics include MTBF, MTTR, availability, PM compliance, planned versus unplanned maintenance, schedule compliance, backlog, repeat failures, OEE, maintenance cost, labor productivity, and critical-asset risk.
What are the most important maintenance KPIs?
For most industrial organizations, MTBF, MTTR, asset availability, PM compliance, planned versus unplanned maintenance, maintenance backlog, repeat failure rate, maintenance cost, and OEE provide a strong foundation. The exact mix should reflect asset criticality and business objectives.
How do you measure maintenance performance?
Maintenance performance should be measured through a combination of reliability outcomes, maintenance execution, cost, asset availability, and risk. No single KPI can represent maintenance effectiveness.
What is the difference between MTBF and MTTR?
MTBF measures the average operating time between failures, while MTTR measures the average time required to repair and restore equipment after failure. MTBF primarily indicates reliability; MTTR primarily indicates maintainability and recovery effectiveness.
What is a good PM compliance KPI?
PM compliance measures whether preventive-maintenance tasks are completed within their required time window. A high percentage is useful, but it should be interpreted alongside failure trends and repeat failures because completing ineffective PM tasks does not necessarily improve reliability.
Should OEE be included in a maintenance KPI dashboard?
Yes, particularly in production environments. However, OEE is a cross-functional metric because it incorporates availability, performance, and quality. Maintenance teams should identify the portion of OEE losses that is attributable to maintenance.
How often should maintenance KPIs be reviewed?
Different KPIs require different review frequencies. Critical operational indicators may require daily or weekly review, while strategic cost and reliability trends may be more useful monthly. The review frequency should match the speed at which management can act.
How many KPIs should a maintenance dashboard have?
There is no universal number, but the primary dashboard should remain focused. A practical executive view can prioritize roughly 8–12 indicators while allowing users to drill into detailed operational and diagnostic metrics.
How can a CMMS improve maintenance KPI tracking?
A CMMS can centralize work orders, asset history, preventive maintenance, scheduling, labor, parts, costs, and other maintenance data. This creates a more consistent foundation for KPI calculation and allows managers to connect performance trends with actual maintenance activity.
How can maintenance KPIs support predictive maintenance?
Predictive maintenance adds forward-looking condition information to historical maintenance KPIs. Combining MTBF, MTTR, failure history, sensor data, condition trends, anomaly detection, and predictive analytics can help identify deteriorating assets before failure occurs.
What is the difference between a maintenance metric and a maintenance KPI?
A maintenance metric is a measurable data point. A KPI is a strategically important metric linked to an objective, decision, or performance outcome. Every KPI is a metric, but not every metric deserves KPI status.


Jai Balachandran is an industry expert with a proven track record in driving digital transformation and Industry 4.0 technologies. With a rich background in asset management, plant maintenance, connected systems, TPM and reliability initiatives, he brings unparalleled insight and delivery excellence to Plant Operations.
Company
Download App