
20 Maintenance KPIs Every Plant Manager Must Track in
2026
Introduction
Manufacturing competitiveness in 2026 is no longer determined solely by production capacity or automation. It is increasingly defined by how effectively organisations measure, manage, and improve asset performance. As manufacturers embrace Industry 4.0, Artificial Intelligence (AI), Industrial Internet of Things (IIoT), and digital maintenance platforms, maintenance is evolving from a reactive support function into a strategic business capability that directly influences profitability, operational resilience, sustainability, and customer satisfaction.
Despite this transformation, many maintenance teams continue to rely on lagging indicators such as total maintenance cost or the number of equipment breakdowns. While these metrics provide historical insight, they rarely offer the predictive intelligence needed to prevent failures before they disrupt production.
Leading manufacturers have shifted towards a data-driven reliability culture, where maintenance decisions are guided by real-time Key Performance Indicators (KPIs). These metrics provide early warning signals of declining equipment health, workforce inefficiencies, planning gaps, and asset risks, enabling maintenance leaders to intervene proactively rather than reactively.
Maintenance KPIs are more than operational statistics. They are strategic management tools that align maintenance performance with broader business objectives, including production uptime, product quality, safety, energy efficiency, cost optimisation, and asset lifecycle management.
When monitored consistently through a modern Computerized Maintenance Management System (CMMS), maintenance KPIs empower plant managers to answer critical operational questions such as:
- Which assets present the highest reliability risk?
- Are preventive maintenance programmes delivering measurable value?
- How quickly are maintenance teams restoring failed equipment?
- Are maintenance costs increasing without corresponding improvements in asset performance?
- Which production lines require reliability improvement initiatives?
- Are predictive maintenance investments generating measurable returns?
The answers to these questions determine whether maintenance functions remain reactive cost centres or become strategic contributors to manufacturing excellence.
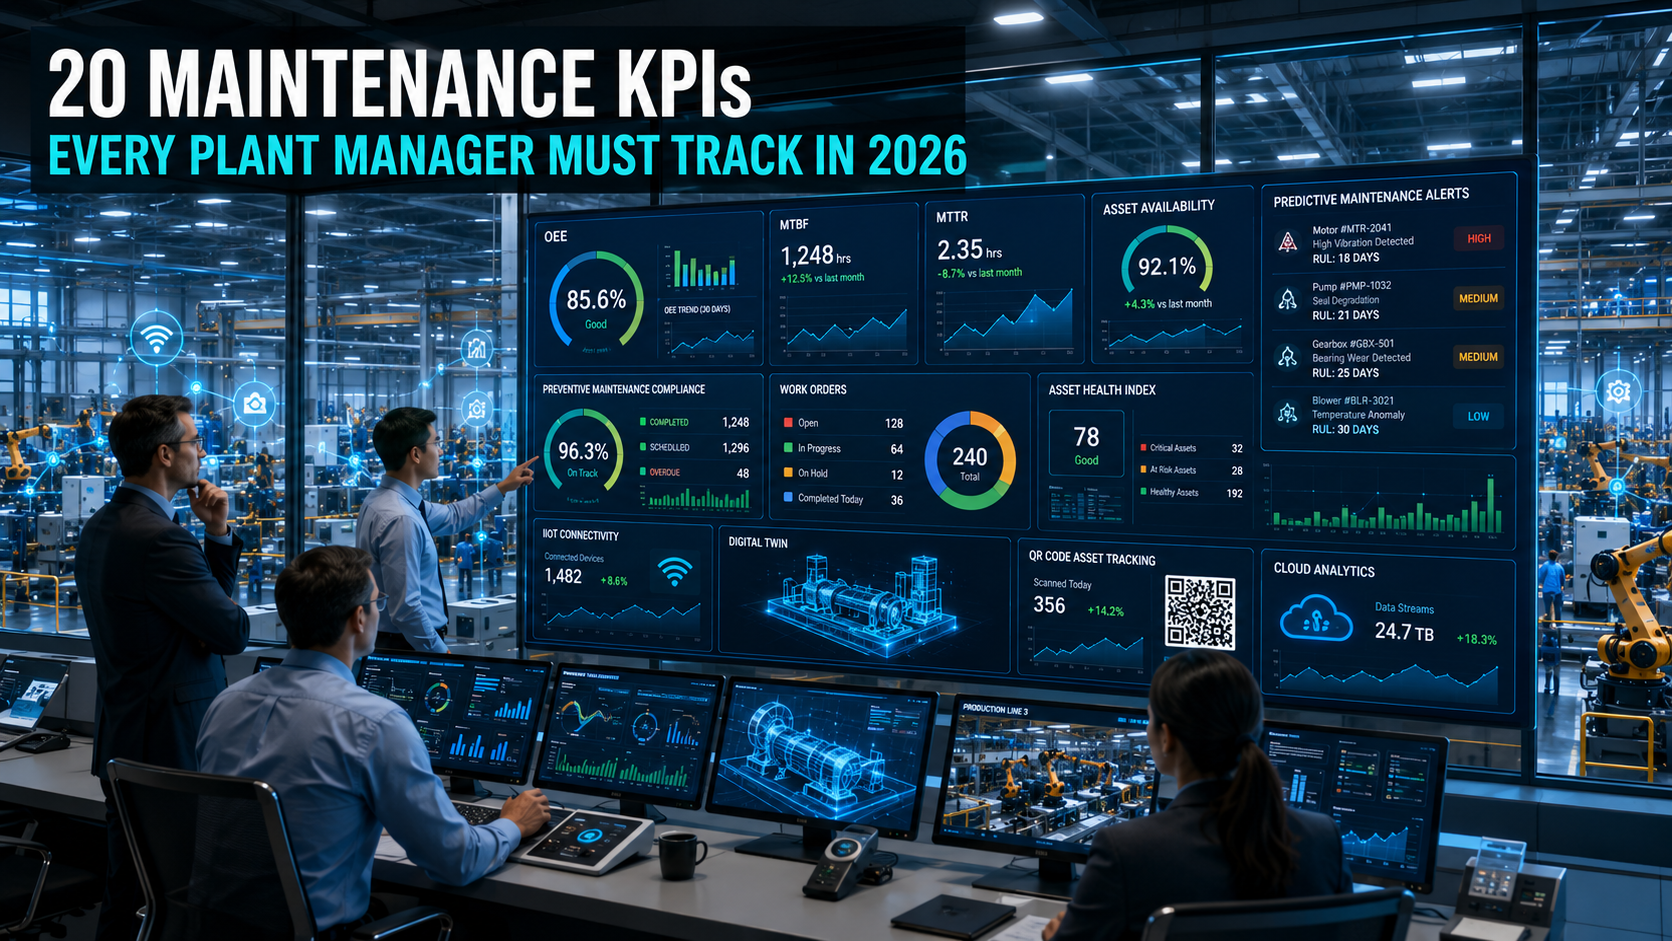
This article explores the 20 most important maintenance KPIs every plant manager should track in 2026, explaining what each metric measures, why it matters, how to calculate it, and how modern CMMS platforms help transform KPI data into actionable operational intelligence.
Why Maintenance KPIs Matter More Than Ever
Today’s manufacturing facilities generate enormous volumes of operational data from sensors, PLCs, SCADA systems, ERP platforms, MES applications, and connected maintenance software. However, collecting data alone does not improve reliability.
Competitive advantage comes from identifying the metrics that genuinely influence operational performance.
Maintenance KPIs enable organisations to:
- Improve equipment availability
- Reduce unplanned downtime
- Increase Overall Equipment Effectiveness (OEE)
- Optimise preventive maintenance programmes
- Lower maintenance costs
- Improve technician productivity
- Extend equipment lifespan
- Strengthen regulatory compliance
- Improve spare parts planning
- Support predictive maintenance initiatives
Rather than measuring maintenance activity, effective KPIs measure maintenance outcomes.
For example, tracking the number of completed work orders provides limited strategic value. Measuring preventive maintenance compliance, Mean Time Between Failures (MTBF), and Mean Time To Repair (MTTR) offers far deeper insight into equipment reliability and maintenance effectiveness.
As maintenance becomes increasingly digital, KPIs also enable executive leadership to monitor operational performance in real time, supporting faster and more informed decision-making across the enterprise.
Characteristics of High-Value Maintenance KPIs
Not every maintenance metric deserves executive attention.
High-performing maintenance organisations focus on KPIs that are:
Actionable
The metric should drive operational improvement rather than simply report historical performance.
Measurable
Reliable data should be consistently available through automated systems rather than manual spreadsheets.
Timely
KPIs should be updated frequently enough to support rapid operational decisions.
Aligned with Business Objectives
Maintenance performance should contribute directly to production, quality, safety, and financial goals.
Easy to Understand
Plant managers, technicians, planners, and executives should interpret KPI trends consistently.
Modern CMMS platforms automate KPI calculation, ensuring that decision-makers receive accurate and timely insights without extensive manual reporting.
KPI 1 – Overall Equipment Effectiveness (OEE)
Why It Matters
Overall Equipment Effectiveness (OEE) is widely recognised as the most comprehensive manufacturing KPI because it combines three essential dimensions of production performance:
- Availability
- Performance
- Quality
Rather than measuring maintenance in isolation, OEE demonstrates how equipment reliability directly influences manufacturing productivity.
A decline in OEE often indicates recurring equipment failures, excessive changeover times, operator inefficiencies, or quality losses—all of which may require maintenance intervention.
Formula
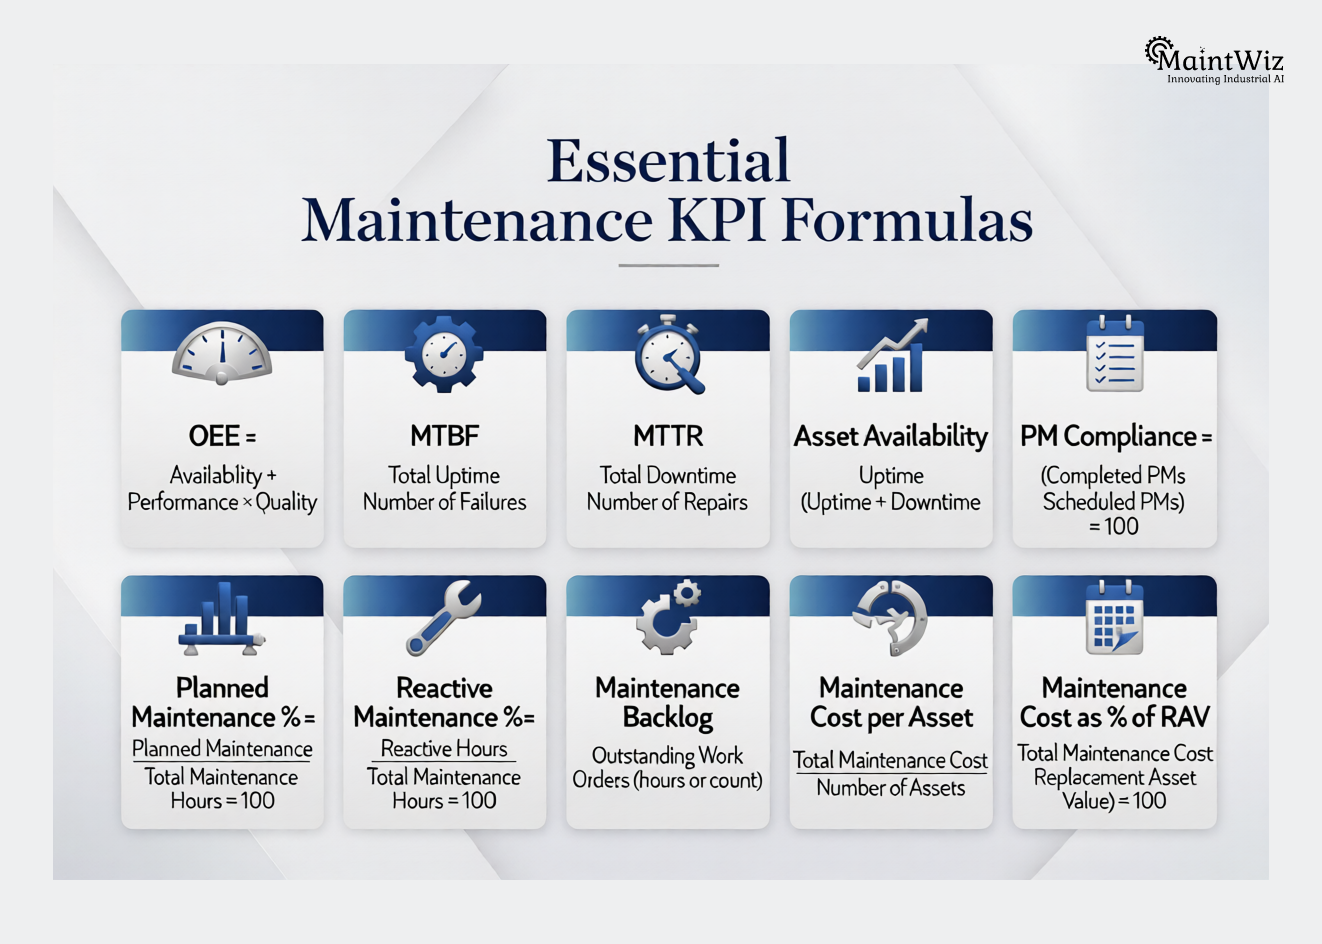
OEE = Availability × Performance × Quality
World-Class Benchmark
85% or higher
Improvement Strategies
- Reduce equipment failures
- Improve preventive maintenance compliance
- Optimise changeovers
- Eliminate recurring defects
- Increase equipment reliability
KPI 2 – Mean Time Between Failures (MTBF)
Why It Matters
Mean Time Between Failures measures the average operating time between equipment failures.
It is one of the most important indicators of equipment reliability and asset health.
Increasing MTBF demonstrates that maintenance programmes are successfully preventing failures rather than merely responding to them.
Formula
MTBF = Total Operating Time ÷ Number of Failures
World-Class Goal
Continuously increasing MTBF.
Higher values indicate better equipment reliability.
Improvement Strategies
- Root Cause Analysis (RCA)
- Predictive maintenance
- Condition monitoring
- Improved lubrication
- Better operator inspections
KPI 3 – Mean Time To Repair (MTTR)
Why It Matters
Equipment failures cannot always be avoided.
The speed at which maintenance teams restore production significantly influences operational performance.
Mean Time To Repair measures maintenance responsiveness and repair efficiency.
Lower MTTR generally reflects:
- Better technician skills
- Improved planning
- Faster spare parts availability
- Standardised repair procedures
- Mobile maintenance execution
Formula
MTTR = Total Repair Time ÷ Number of Repairs
Target
Continuously decreasing MTTR.
Improvement Strategies
- Digital work orders
- Mobile CMMS
- QR code asset identification
- Standard repair procedures
- Spare parts optimisation
KPI 4 – Asset Availability
Why It Matters
Availability measures the percentage of scheduled production time during which equipment is operational and capable of producing output.
Unlike MTBF or MTTR, availability reflects the actual business impact of maintenance performance on production.
Even small improvements in asset availability can significantly increase annual production capacity without investing in additional machinery.
Formula
Availability (%) = (Operating Time ÷ Planned Production Time) × 100
Target
Above 95% for critical production assets.
Improvement Strategies
- Improve preventive maintenance planning
- Reduce emergency repairs
- Increase predictive maintenance coverage
- Eliminate recurring equipment failures
KPI 5 – Preventive Maintenance Compliance
Why It Matters
Preventive maintenance programmes only deliver value when maintenance activities are completed on schedule.
Delayed inspections, postponed servicing, and missed lubrication tasks frequently become the root causes of future equipment failures.
Preventive Maintenance Compliance measures how consistently maintenance teams execute planned maintenance.
Formula
PM Compliance = (Completed PM Tasks ÷ Scheduled PM Tasks) × 100
World-Class Benchmark
95–100%
Improvement Strategies
- Automated scheduling
- Mobile maintenance
- Technician accountability
- Workload balancing
- CMMS reminders
High compliance rates reduce equipment failures while improving long-term asset reliability.
KPI 6 – Planned Maintenance Percentage (PMP)
Why It Matters
World-class maintenance organisations spend most of their time performing planned work rather than responding to unexpected equipment failures.
Planned Maintenance Percentage measures how much maintenance effort is proactive.
Formula
PMP = (Hours Spent on Planned Maintenance ÷ Total Maintenance Hours) × 100
Industry Benchmark
- World-Class: 80–90%
- Developing Plants: 60–75%
- Reactive Plants: Below 50%
A high Planned Maintenance Percentage indicates mature maintenance planning processes, improved reliability, and lower emergency maintenance costs.
Improvement Strategies
- Develop structured maintenance schedules
- Increase preventive maintenance coverage
- Implement predictive maintenance technologies
- Reduce reactive work orders
- Use CMMS planning and scheduling tools to optimise labour allocation
KPI 7 – Reactive Maintenance Percentage
Why It Matters
Reactive maintenance remains one of the largest hidden cost drivers in manufacturing. Emergency repairs typically cost three to five times more than planned maintenance because they involve unplanned labour, production losses, overtime, expedited spare parts, and quality risks.
Reactive Maintenance Percentage measures how much maintenance effort is devoted to emergency work rather than planned activities.
World-class manufacturers increasingly target low reactive maintenance levels because high-performing plants understand that reliability is created through planning, inspection, condition monitoring, and predictive intervention.
Formula
Reactive Maintenance Percentage = (Reactive Maintenance Hours ÷ Total Maintenance Hours) × 100
Benchmark
- World-Class: Less than 20%
- Average Plants: 20–40%
- Reactive Plants: Above 40%
Improvement Strategies
- Strengthen preventive maintenance programmes
- Implement condition monitoring
- Increase predictive maintenance coverage
- Improve spare parts availability
- Conduct Root Cause Analysis (RCA)
- Use CMMS planning tools
A decreasing reactive maintenance percentage generally indicates improving asset reliability.
KPI 8 – Maintenance Backlog
Why It Matters
Maintenance backlog measures the volume of pending maintenance work that has not yet been completed.
A moderate backlog is healthy because it provides planners with work visibility and scheduling flexibility. However, excessive backlog increases failure risks, delays preventive maintenance, and contributes to unplanned downtime.
Maintenance backlog is a leading indicator of future reliability problems.
Formula
Maintenance Backlog (Weeks) = Total Outstanding Maintenance Hours ÷ Available Labour Hours per Week
Recommended Benchmark
- Optimal: 2–4 weeks
- Risk Zone: More than 6 weeks
Improvement Strategies
- Improve planning and scheduling
- Prioritise work orders
- Eliminate low-value tasks
- Increase PM effectiveness
- Optimise workforce allocation
Modern CMMS systems help maintenance teams visualise backlog by priority, asset criticality, and resource availability.
KPI 9 – Maintenance Cost per Asset
Why It Matters
Understanding maintenance expenditure at the asset level enables better lifecycle decisions.
Some assets become increasingly expensive to maintain due to ageing, obsolescence, poor design, or chronic reliability problems.
Maintenance Cost per Asset supports decisions related to:
- Asset replacement
- Reliability improvements
- Capital investment
- Maintenance optimisation
Formula
Maintenance Cost per Asset = Total Maintenance Cost ÷ Number of Assets
What to Monitor
Track:
- Cost trends over time
- Cost by asset category
- Cost by production line
- Cost by equipment criticality
Improvement Strategies
- Asset criticality analysis
- Reliability-centred maintenance
- Root Cause Analysis
- Predictive maintenance
- Asset replacement planning
KPI 10 – Maintenance Cost as a Percentage of Replacement Asset Value (RAV)
Why It Matters
This KPI evaluates maintenance efficiency relative to total asset value.
It helps determine whether maintenance expenditure is appropriate compared with the replacement cost of equipment.
Formula
Maintenance Cost % RAV = (Annual Maintenance Cost ÷ Replacement Asset Value) × 100
Industry Benchmark
- World-Class: 2–3%
- Average: 3–5%
- High Cost: Above 5%
Example
If:
- Annual maintenance cost = £800,000
- Asset replacement value = £25 million
Then:
Maintenance Cost % RAV:
(£800,000 ÷ £25,000,000) × 100 = 3.2%
This indicates reasonable maintenance efficiency.
Improvement Strategies
- Improve planning
- Increase PM effectiveness
- Reduce repeat failures
- Extend equipment life
- Optimise spare parts
KPI 11 – Schedule Compliance
Why It Matters
Maintenance schedules create operational discipline.
Schedule Compliance measures whether planned maintenance work is completed according to schedule.
Poor compliance leads to:
- Delayed inspections
- Increased failures
- Higher reactive maintenance
- Greater operational risk
Formula
Schedule Compliance = (Completed Scheduled Work ÷ Planned Work) × 100
Benchmark
- World-Class: Above 90%
Improvement Strategies
- Better planning
- Labour balancing
- Mobile work orders
- Realistic schedules
- Daily maintenance reviews
High schedule compliance often correlates strongly with high asset reliability.
KPI 12 – Work Order Completion Rate
Why It Matters
Work orders represent the operational heartbeat of maintenance.
Low completion rates may indicate:
- Resource shortages
- Planning inefficiencies
- Excessive emergencies
- Poor technician utilisation
Formula
Work Order Completion Rate = (Completed Work Orders ÷ Total Work Orders) × 100
Benchmark
- Target: Above 90%
Improvement Strategies
- Digital work orders
- Mobile CMMS
- QR asset tracking
- Improved scheduling
- Standard job plans
CMMS platforms automate work order workflows, significantly improving execution efficiency.
KPI 13 – Technician Productivity
Why It Matters
Maintenance effectiveness depends not only on workforce size but also on productive labour utilisation.
Technician Productivity measures how much technician time is spent on value-adding activities.
Many organisations discover that technicians spend considerable time searching for:
- Information
- Spare parts
- Tools
- Documentation
- Approvals
Formula
Technician Productivity = (Productive Maintenance Hours ÷ Total Available Hours) × 100
Benchmark
- World-Class: 65–75%
Improvement Strategies
- Mobile CMMS
- Digital work instructions
- QR asset identification
- Better planning
- Spare parts availability
Even a 10% improvement in technician productivity can significantly increase maintenance capacity.
KPI 14 – Spare Parts Inventory Turnover
Why It Matters
Excess inventory ties up working capital, while insufficient inventory creates production risks.
Spare Parts Inventory Turnover measures inventory efficiency.
Formula
Inventory Turnover = Annual Spare Parts Usage ÷ Average Inventory Value
High Turnover Indicates
- Effective inventory management
- Reduced obsolete stock
- Better forecasting
- Lower carrying costs
Improvement Strategies
- ABC inventory analysis
- Critical spares classification
- Demand forecasting
- CMMS inventory management
- Supplier collaboration
Modern maintenance organisations integrate CMMS, procurement, and inventory systems to optimise spare parts availability without increasing stock levels.
KPI Relationships: The Maintenance Performance Chain
Individual KPIs provide valuable insights, but the greatest value comes from understanding how KPIs influence one another.
For example:
Higher PM Compliance
↓
Fewer Failures
↓
Higher MTBF
↓
Lower MTTR
↓
Reduced Downtime
↓
Higher Availability
↓
Improved OEE
↓
Greater Production Output
This cause-and-effect relationship transforms maintenance KPIs from isolated metrics into an integrated reliability management system.
Executive KPI Dashboard for 2026
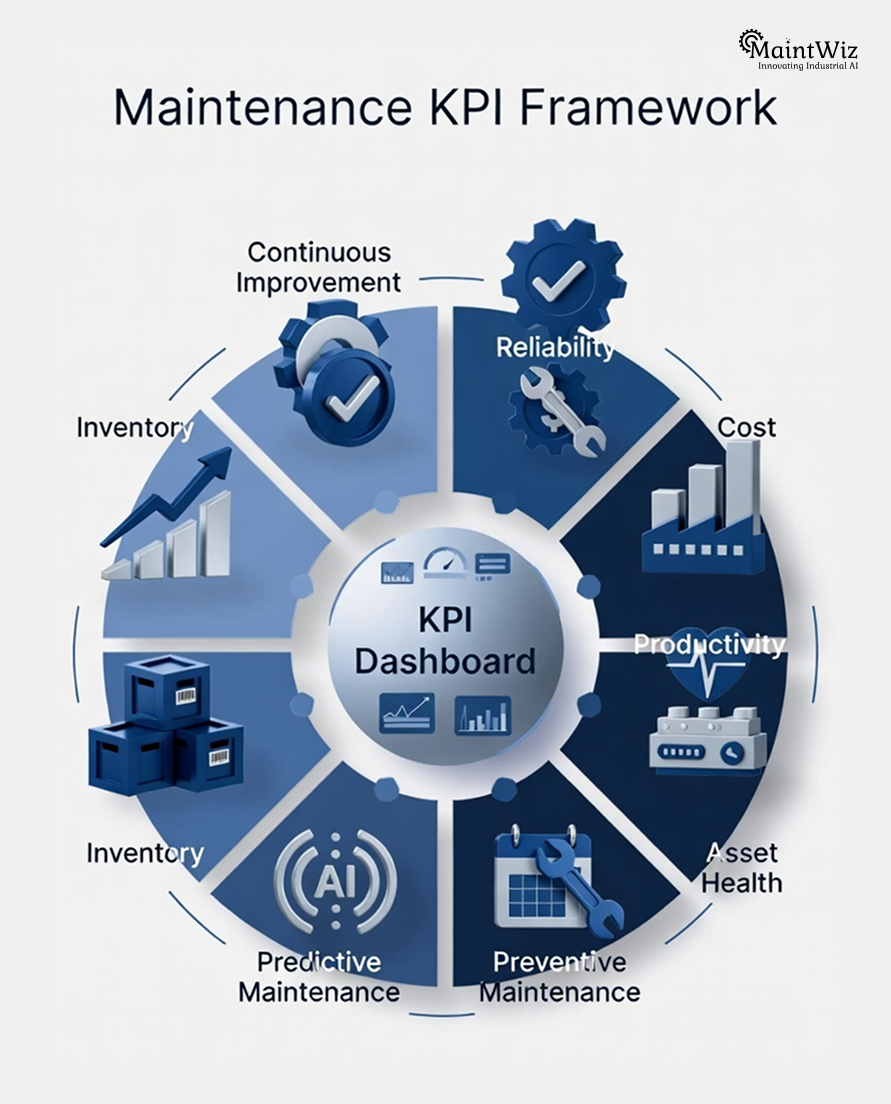
Plant managers should monitor a balanced KPI portfolio:
Reliability KPIs
- MTBF
- MTTR
- Asset Availability
- OEE
Maintenance Execution KPIs
- PM Compliance
- Schedule Compliance
- Work Order Completion
Financial KPIs
- Maintenance Cost per Asset
- Maintenance Cost % RAV
- Inventory Turnover
Workforce KPIs
- Technician Productivity
- Planned Maintenance Percentage
Strategic KPIs
- Reactive Maintenance %
- Backlog
- Predictive Maintenance Coverage
Leading manufacturers increasingly use AI-powered CMMS dashboards to visualise KPI trends in real time rather than relying on monthly spreadsheet reports.
KPI 15 – Predictive Maintenance Coverage
Why It Matters
As manufacturing plants adopt Industry 4.0 technologies, maintenance strategies are shifting from time-based servicing to condition-based and predictive maintenance. Predictive Maintenance Coverage measures the proportion of critical assets monitored using AI, IIoT sensors, vibration analysis, thermal imaging, oil analysis, or other predictive techniques.
A higher coverage percentage indicates greater organisational maturity in anticipating failures before they disrupt production.

Formula
Predictive Maintenance Coverage (%) = (Assets Under Predictive Monitoring ÷ Total Critical Assets) × 100
Benchmark
- World-Class: Above 80%
- Developing Organisations: 40–70%
- Reactive Organisations: Below 30%
Improvement Strategies
- Deploy IIoT sensors on critical equipment
- Integrate predictive analytics with CMMS
- Prioritise high-risk assets
- Implement AI-based failure prediction models
- Review predictive alerts during weekly maintenance planning
KPI 16 – Emergency Work Order Percentage
Why It Matters
Emergency work orders are expensive because they interrupt planned schedules, require immediate labour allocation, increase overtime, and often result in production losses.
Monitoring the percentage of emergency work orders provides a clear indication of maintenance planning effectiveness.
Formula
Emergency Work Order Percentage = (Emergency Work Orders ÷ Total Work Orders) × 100
Benchmark
- World-Class: Less than 10%
- Average Plants: 10–20%
- High Risk: Above 20%
Improvement Strategies
- Improve preventive maintenance compliance
- Increase predictive maintenance adoption
- Conduct failure mode analysis
- Standardise inspection routes
- Optimise maintenance scheduling
Reducing emergency work orders improves labour utilisation, equipment availability, and maintenance costs.
KPI 17 – First-Time Fix Rate (FTFR)
Why It Matters
First-Time Fix Rate measures how often technicians resolve equipment issues during their initial visit without requiring follow-up work.
A high FTFR reflects effective planning, technician competence, spare parts availability, and access to accurate maintenance information.
Formula
First-Time Fix Rate = (Successful First Repairs ÷ Total Repairs) × 100
World-Class Benchmark
Above 90%
Improvement Strategies
- Digital work instructions
- Mobile CMMS access
- QR code asset identification
- Technician training
- Accurate spare parts planning
- Standardised repair procedures
Higher FTFR reduces repeat failures, improves technician productivity, and minimises production disruption.
KPI 18 – Asset Health Index (AHI)
Why It Matters
The Asset Health Index is an aggregated score that reflects the current condition and operational risk of an asset based on multiple variables, including:
- Equipment age
- Failure frequency
- Maintenance history
- Sensor data
- Operating conditions
- Inspection findings
- Remaining Useful Life (RUL)
Rather than reacting to individual alarms, maintenance teams can prioritise interventions based on overall asset health.
Typical Rating Scale
- 90–100: Excellent
- 75–89: Good
- 60–74: Moderate Risk
- Below 60: High Risk
Improvement Strategies
- Continuous condition monitoring
- Predictive maintenance
- Reliability-centred maintenance
- Root Cause Analysis
- Asset refurbishment or replacement
AI-powered CMMS platforms automatically calculate Asset Health Index values by combining maintenance and operational data.
KPI 19 – Maintenance Schedule Adherence
Why It Matters
Maintenance schedules are effective only when executed as planned.
Schedule adherence measures whether maintenance teams perform work at the planned time without unnecessary delays or rescheduling.
Consistent schedule adherence improves maintenance efficiency and production coordination.
Formula
Schedule Adherence (%) = (Maintenance Tasks Completed on Schedule ÷ Planned Maintenance Tasks) × 100
Benchmark
Above 90%
Improvement Strategies
- Weekly planning meetings
- Resource optimisation
- Digital scheduling
- Mobile technician notifications
- Better coordination with production teams
KPI 20 – Maintenance Return on Investment (Maintenance ROI)
Why It Matters
Executive leadership increasingly expects maintenance departments to demonstrate measurable business value.
Maintenance ROI evaluates whether maintenance investments generate financial returns through:
- Reduced downtime
- Increased production output
- Lower maintenance costs
- Improved equipment reliability
- Extended asset life
- Higher Overall Equipment Effectiveness (OEE)
Formula
Maintenance ROI = (Financial Benefits – Maintenance Investment) ÷ Maintenance Investment × 100
Example
A manufacturer invests £500,000 in a predictive maintenance programme and achieves:
- £850,000 reduction in downtime losses
- £150,000 maintenance cost savings
Total benefit:
£1,000,000
Maintenance ROI:
((£1,000,000 – £500,000) ÷ £500,000) × 100 = 100%
Maintenance leaders increasingly use ROI metrics to justify investments in AI, IIoT, digital maintenance, and CMMS platforms.
Building an Executive Maintenance KPI Dashboard
Tracking twenty KPIs individually can overwhelm maintenance teams. High-performing organisations simplify decision-making by consolidating operational metrics into a real-time executive dashboard.
An effective dashboard should include:
Reliability
- Overall Equipment Effectiveness (OEE)
- Asset Availability
- MTBF
- MTTR
- Asset Health Index
Maintenance Execution
- Preventive Maintenance Compliance
- Planned Maintenance Percentage
- Schedule Compliance
- Emergency Work Order Percentage
- Work Order Completion Rate
Workforce Performance
- Technician Productivity
- First-Time Fix Rate
- Maintenance Backlog
Financial Performance
- Maintenance Cost per Asset
- Maintenance Cost as % of RAV
- Spare Parts Inventory Turnover
- Maintenance ROI
Predictive Maintenance
- Predictive Maintenance Coverage
- Critical Asset Health
- Remaining Useful Life (RUL)
- AI-generated maintenance recommendations
With a live CMMS dashboard, plant managers can identify emerging reliability issues, prioritise resources, and make evidence-based decisions before failures impact production.
How MaintWiz CMMS Supports KPI-Driven Maintenance Excellence
Maintenance KPIs are only valuable when supported by reliable, real-time data. Many organisations still rely on spreadsheets and manual reporting, which often results in delayed insights and inconsistent calculations.
MaintWiz CMMS provides a unified platform that automates KPI collection, analysis, and reporting across the maintenance lifecycle.
Centralised Asset Intelligence
MaintWiz maintains a comprehensive digital asset register containing equipment specifications, maintenance history, inspection records, warranties, manuals, and asset criticality. This creates a single source of truth for reliability analysis.
Automated Preventive Maintenance
The platform automatically schedules preventive maintenance based on calendar dates, runtime hours, production cycles, meter readings, or condition-based triggers, improving preventive maintenance compliance and reducing reactive work.
AI-Powered Predictive Maintenance
MaintWiz integrates with IIoT devices and condition-monitoring systems to analyse vibration, temperature, lubrication quality, electrical parameters, and other sensor data. AI models detect developing equipment issues, enabling maintenance teams to intervene before failures occur.
Mobile Work Order Management
Technicians receive digital work orders on mobile devices with QR code asset identification, inspection checklists, safety procedures, technical documents, and spare parts information. Real-time updates improve schedule compliance and technician productivity.
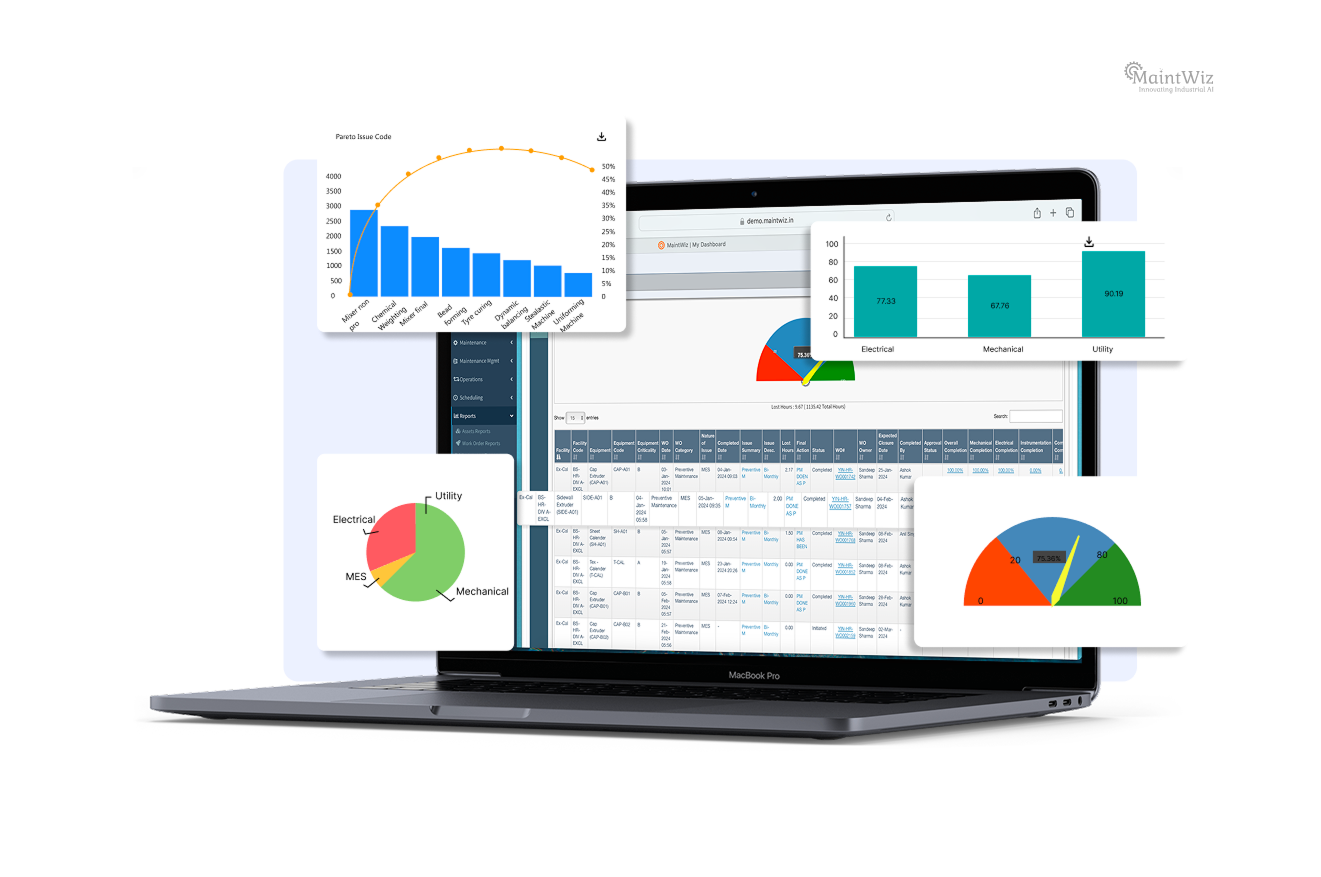
Advanced Maintenance Analytics
Interactive dashboards provide real-time visibility into:
- OEE
- MTBF
- MTTR
- Asset Availability
- Preventive Maintenance Compliance
- Maintenance Backlog
- Technician Productivity
- Maintenance Costs
- Spare Parts Consumption
- Asset Health Scores
These dashboards enable maintenance leaders to monitor trends, benchmark performance, and identify opportunities for continuous improvement.
A Practical 90-Day Maintenance KPI Improvement Roadmap
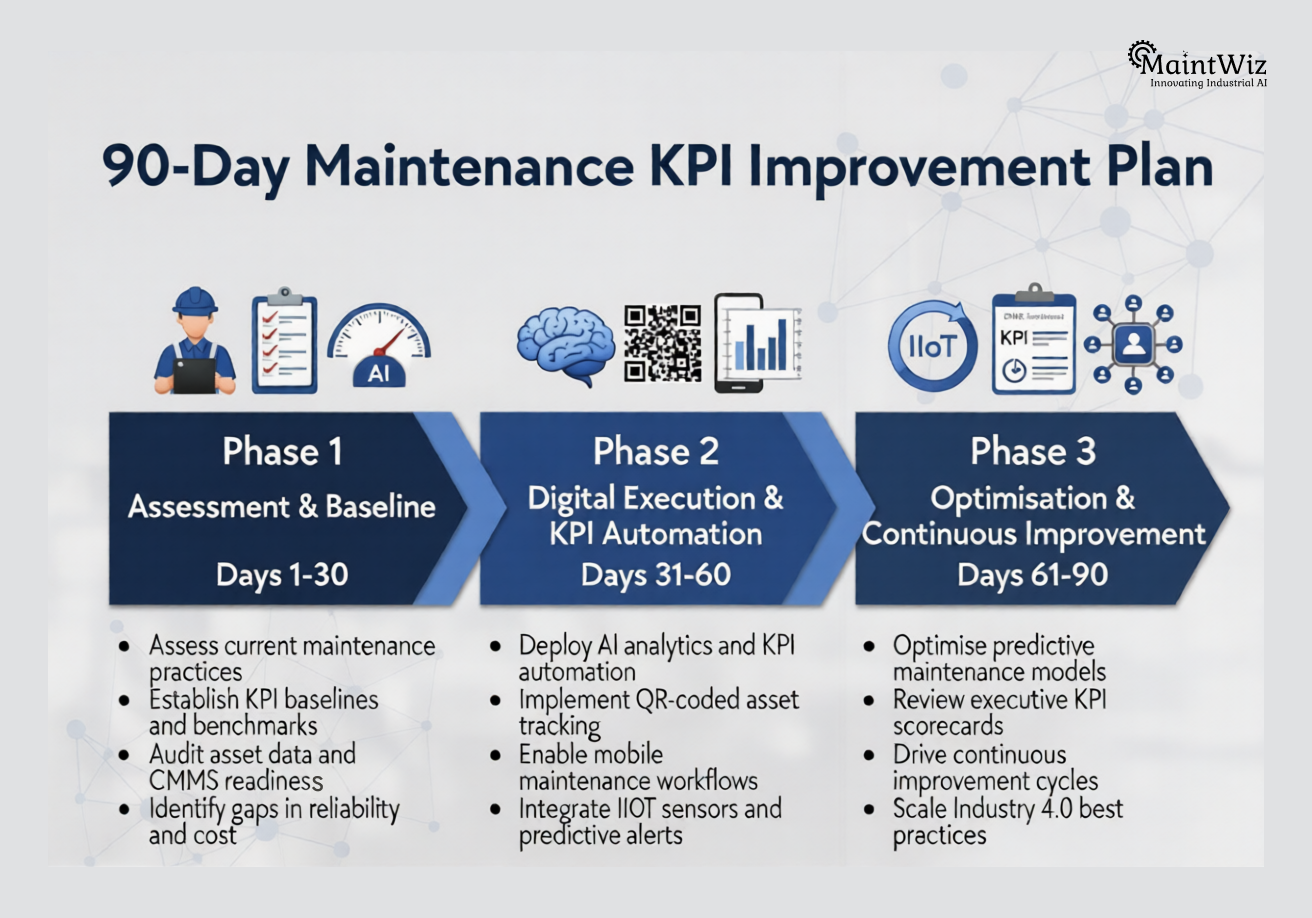
Days 1–30: Assess and Establish Baselines
Focus Areas:
- Audit existing maintenance processes
- Create an asset criticality matrix
- Define KPI ownership
- Configure CMMS dashboards
- Capture baseline performance data
Deliverables:
- Asset Register
- Maintenance KPI Baseline
- Reliability Assessment
- Executive Dashboard Framework
Days 31–60: Standardise and Digitise
Focus Areas:
- Digitise preventive maintenance schedules
- Deploy mobile work orders
- Implement QR code asset tracking
- Standardise job plans
- Train maintenance teams on KPI reporting
Deliverables:
- Digital Maintenance Workflows
- Automated KPI Reporting
- Mobile Maintenance Deployment
- Improved Schedule Compliance
Days 61–90: Optimise and Continuously Improve
Focus Areas:
- Introduce predictive maintenance
- Integrate IIoT sensor data
- Analyse KPI trends
- Conduct Root Cause Analysis for recurring failures
- Review executive performance monthly
Deliverables:
- AI-driven predictive maintenance
- Continuous KPI monitoring
- Reliability improvement initiatives
- Executive maintenance scorecards
By following this structured roadmap, organisations can transition from reactive maintenance management to a KPI-driven culture focused on asset reliability, operational excellence, and measurable business outcomes.
Conclusion
In 2026, maintenance success will be defined not by the number of work orders completed, but by the ability to measure, interpret, and continuously improve the indicators that drive operational performance.

The twenty maintenance KPIs outlined in this guide provide a comprehensive framework for evaluating reliability, maintenance execution, workforce productivity, financial efficiency, and predictive maintenance maturity. Together, they offer plant managers a balanced view of maintenance performance, enabling informed decisions that improve equipment availability, reduce downtime, optimise costs, and extend asset life.
When these KPIs are monitored through an AI-powered CMMS platform, maintenance evolves from a reactive support function into a strategic driver of manufacturing excellence. Organisations that embed KPI-driven decision-making into their maintenance strategy will be better positioned to achieve higher Overall Equipment Effectiveness, stronger operational resilience, and sustainable competitive advantage in the era of Industry 4.0.
Frequently Asked Questions
1. What are maintenance KPIs?
Maintenance KPIs (Key Performance Indicators) are measurable metrics used to evaluate maintenance performance, equipment reliability, workforce productivity, maintenance costs, and overall asset effectiveness.
2. Which maintenance KPI is the most important?
Overall Equipment Effectiveness (OEE) is widely regarded as the most comprehensive maintenance KPI because it combines equipment availability, performance, and product quality into a single metric.
3. What is a good MTBF value?
There is no universal MTBF benchmark because it varies by equipment type and industry. However, increasing MTBF over time generally indicates improving equipment reliability.
4. How does a CMMS improve maintenance KPIs?
A CMMS automates preventive maintenance schedules, manages work orders, tracks asset history, monitors inventory, and provides real-time dashboards that improve maintenance planning and KPI reporting.
5. Why should plant managers monitor maintenance KPIs?
Maintenance KPIs help plant managers reduce downtime, improve equipment reliability, optimise maintenance costs, increase technician productivity, and support data-driven operational decisions.
6. Which KPIs are essential for predictive maintenance?
Important predictive maintenance KPIs include Asset Health Index, Predictive Maintenance Coverage, MTBF, MTTR, Remaining Useful Life (RUL), equipment availability, and emergency work order percentage.


Jai Balachandran is an industry expert with a proven track record in driving digital transformation and Industry 4.0 technologies. With a rich background in asset management, plant maintenance, connected systems, TPM and reliability initiatives, he brings unparalleled insight and delivery excellence to Plant Operations.
Company
Download App