This One Energy Dashboard Changed How Our Executives Think About Maintenance
Industrial maintenance rarely gets applause in the boardroom.
It gets questioned.
It gets cost-optimized.
It gets scrutinized.
But it rarely gets celebrated as a strategic growth lever.
Until one day — an energy dashboard changed everything.
In a single executive review meeting, real-time energy intelligence connected to asset performance reframed maintenance from a “necessary expense” to a profit protection engine.
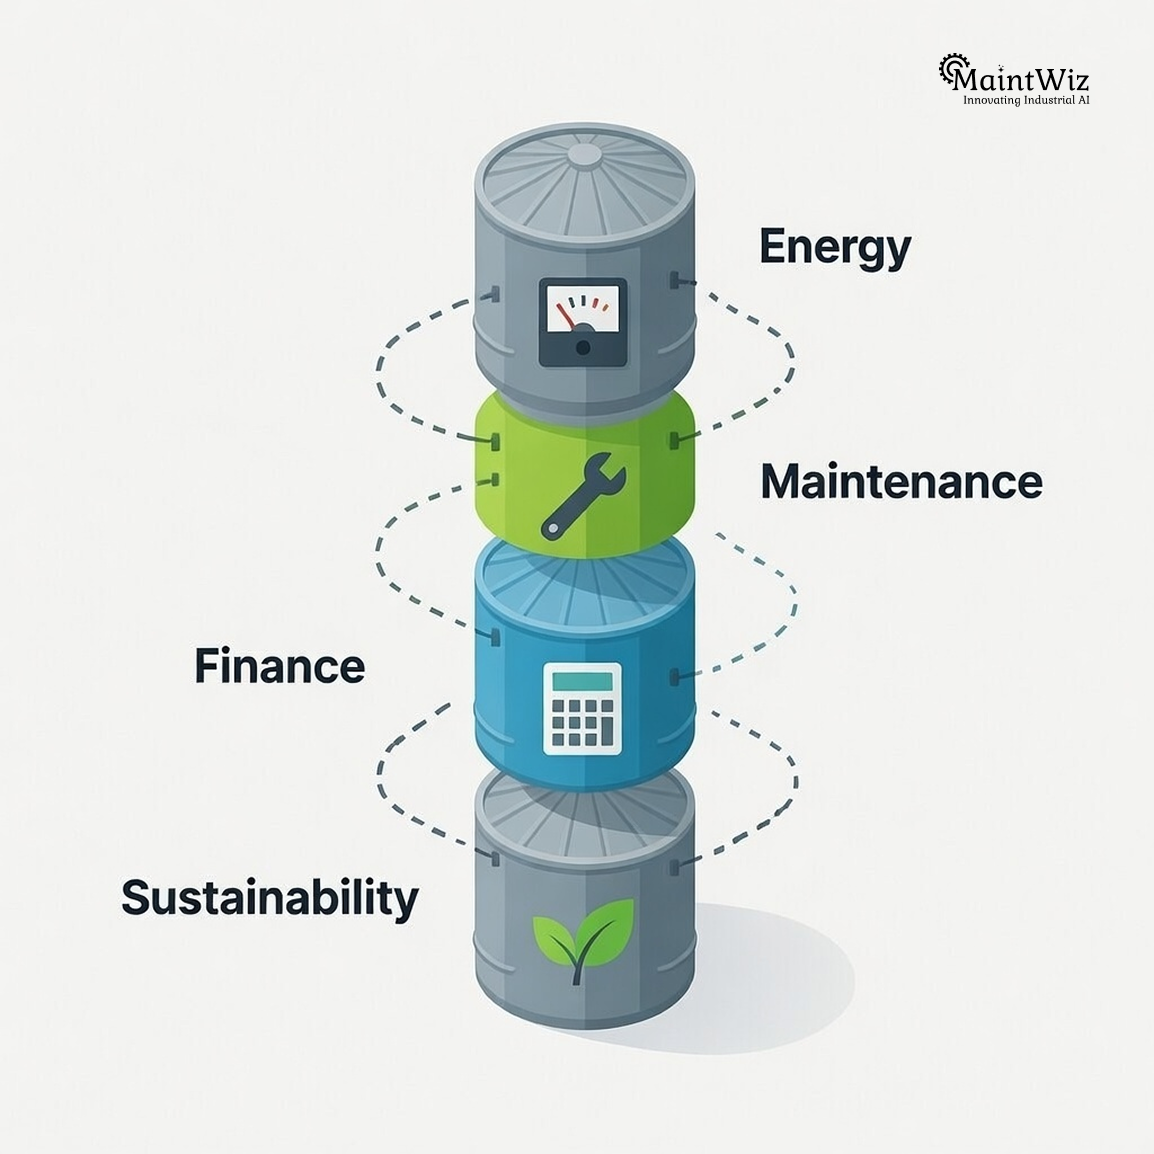
This is the story of how energy-integrated asset management — powered by modern AI-driven CMMS platforms like MaintWiz — is transforming industrial maintenance into a board-level strategic function.
If you’re a plant head, reliability leader, COO, CFO, or sustainability executive, this article will challenge how you view maintenance performance, energy management, and digital transformation.
The Hidden Financial Leak: Why Energy Is the New Maintenance KPI
Overview
In most industrial plants, energy is the second or third largest operating cost after raw materials and labor. Yet it remains poorly integrated into maintenance decision-making.
The problem isn’t lack of data. It’s lack of correlation.
Energy meters record consumption. Maintenance teams manage work orders. Finance tracks costs. Sustainability teams report emissions.
But rarely are these systems unified.
The Energy–Maintenance Disconnect
Here’s where organizations lose millions annually:
- Energy as an Overhead Line Item
Energy costs are often aggregated at plant level, not asset level. Without asset-level energy visibility, inefficiencies remain hidden. - Maintenance KPIs Without Energy Correlation
MTBF, MTTR, and OEE are tracked — but not energy intensity per asset. - Reactive Response to Energy Spikes
Energy anomalies are noticed only after billing cycles, not in real time. - No Predictive Energy Intelligence
Early signs of asset degradation often show up as energy pattern deviations — but go unnoticed.
This is precisely where an integrated energy dashboard becomes transformational.
The Executive Moment: When Energy Became Visible
Overvie
Executives respond to clarity.
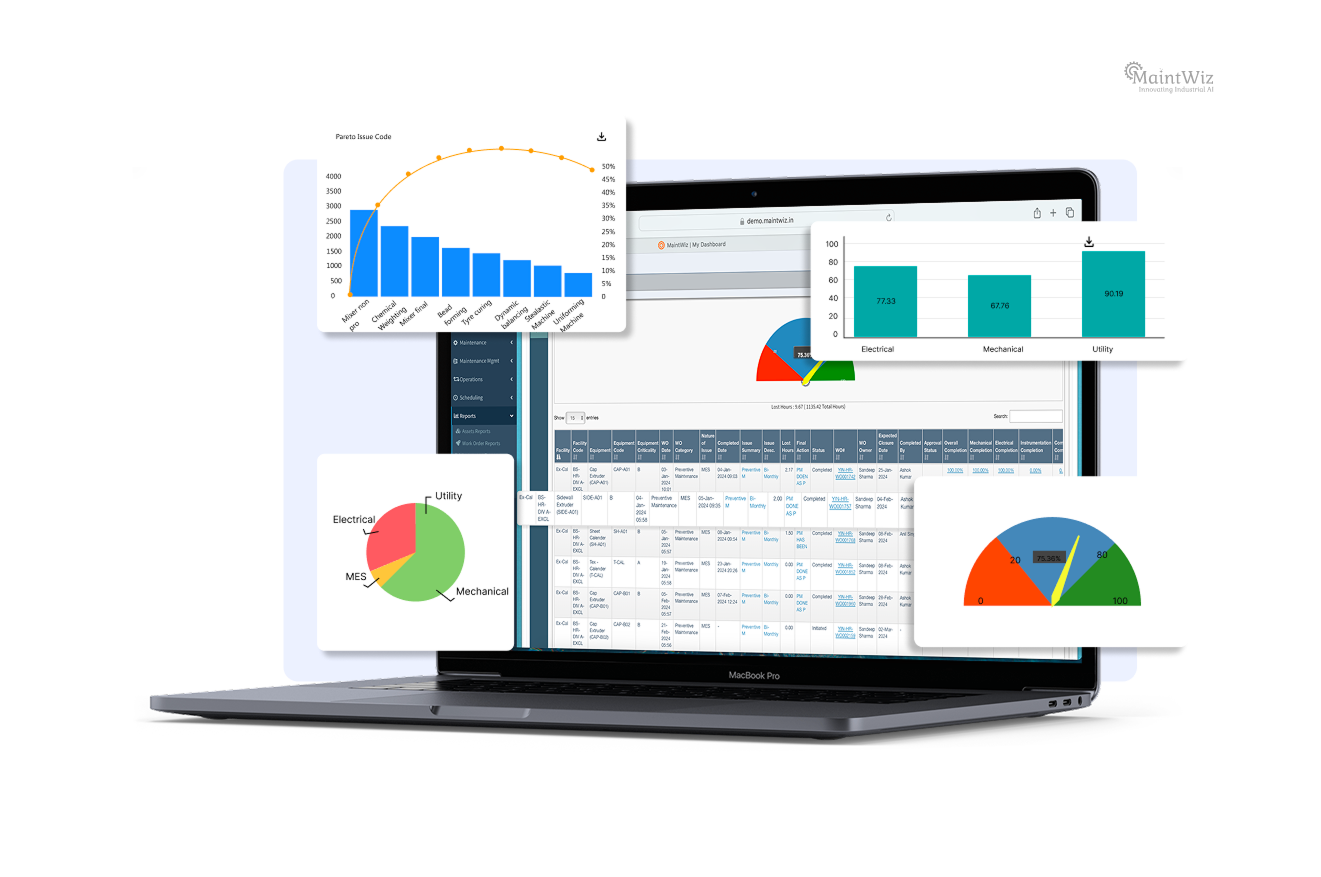
When we implemented a real-time energy dashboard connected to asset health data inside our CMMS, leadership saw something they had never seen before:
Energy spikes directly aligned with maintenance backlog and asset condition.
Silence filled the room.
The narrative changed from “Why is maintenance over budget?” to “Why are we not investing more in predictive maintenance?”
What the Dashboard Revealed
- Energy Intensity by Asset
High-consumption assets were directly linked to lubrication failures and misalignment issues. - Shift-Based Energy Variance
Energy usage varied significantly by shift — revealing process discipline gaps. - Compressed Air and HVAC Energy Losses
Hidden leaks and inefficiencies surfaced immediately. - Predictive Maintenance Gaps
Assets under reactive maintenance showed significantly higher energy variability.
Energy became a leading indicator — not just a utility expense.
Why Energy Intelligence Is the Future of Asset Management
Overview
Energy consumption reflects mechanical truth.
Friction increases? Energy rises.
Misalignment develops? Energy spikes.
Degradation accelerates? Energy pattern shifts.
Modern AI-enabled CMMS platforms can interpret these patterns in real time.
Energy-Driven Asset Performance Strategy
- Energy as a Leading Indicator of Failure
Pattern recognition models detect abnormal consumption before breakdown occurs. - Work Order Prioritization by Energy Risk
Assets showing abnormal energy trends receive higher maintenance priority. - Energy-Based Asset Criticality Index
Energy intensity is integrated into risk scoring frameworks. - Energy-Linked Preventive Maintenance Optimization
PM intervals are adjusted based on energy performance deviations.
This is not theory. This is operational intelligence.
Traditional CMMS vs Energy-Integrated AI CMMS
Overview
Most legacy CMMS systems manage tasks.
Modern AI-powered CMMS platforms manage performance.
The difference is profound.
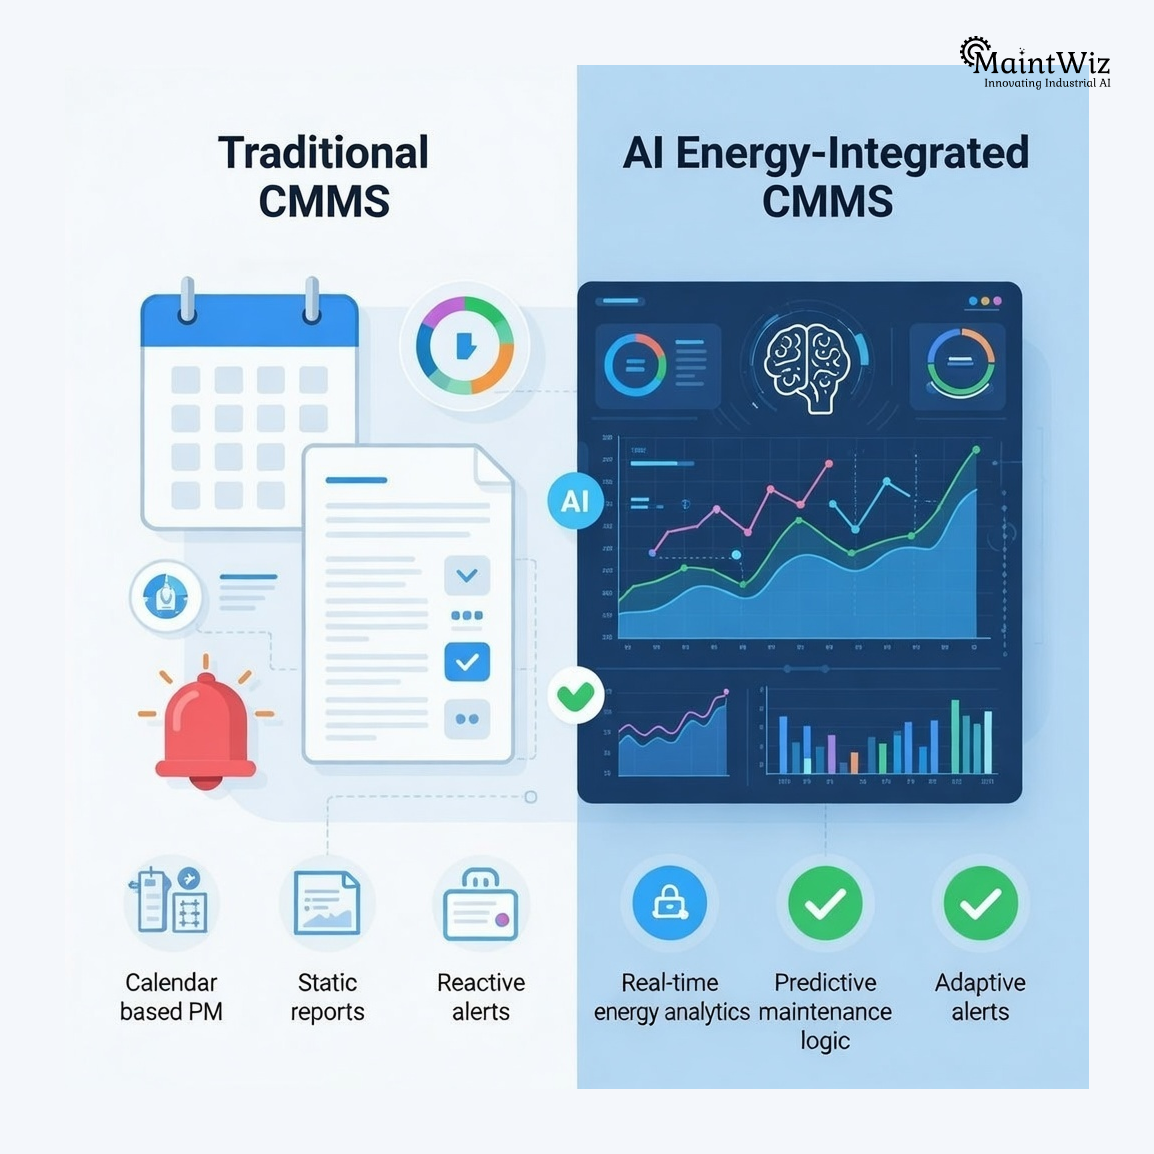
- Data Recording vs Data Interpretation
Traditional CMMS logs work history.
AI CMMS interprets data patterns. - Calendar-Based PM vs Condition-Based PM
Legacy systems follow schedules.
AI systems adapt to asset behavior. - Static Reports vs Real-Time Dashboards
Old systems generate monthly reports.
Modern platforms deliver live intelligence. - Siloed Maintenance vs Integrated Energy Strategy
Advanced platforms connect IoT energy meters, ERP, and asset history.
MaintWiz AI CMMS is architected around this modern paradigm.
The Business Case: Quantifying Energy-Integrated Maintenance
Overview
Executives think in ROI, EBITDA, and risk mitigation.
Energy-integrated maintenance directly impacts all three.
Quantifiable Impact
- 10–20% Energy Waste Reduction
Real-time anomaly detection reduces unnecessary consumption. - Lower Unplanned Downtime
Energy deviations trigger early interventions. - Extended Asset Life
Reduced stress on equipment lowers lifecycle costs. - Improved ESG Performance
Energy optimization reduces carbon footprint. - Higher Maintenance Productivity
Intelligent prioritization reduces firefighting.
When energy dashboards connect to maintenance workflows, the CFO sees measurable results.
The Technology Backbone: How It Works
Overview
Behind the dashboard lies an integrated ecosystem:
IoT + AI + CMMS + ERP + Cloud Analytics.
MaintWiz AI CMMS serves as the orchestration layer.
Integrated Digital Architecture
- IoT Energy Meter Integration
Real-time power data captured at asset level. - AI Analytics Engine
Machine learning models identify anomalies and degradation patterns. - Predictive Maintenance Module
Automated alerts generate work orders. - ERP Integration
Energy savings mapped to financial impact. - Mobile Maintenance Execution
Technicians receive prioritized tasks instantly.
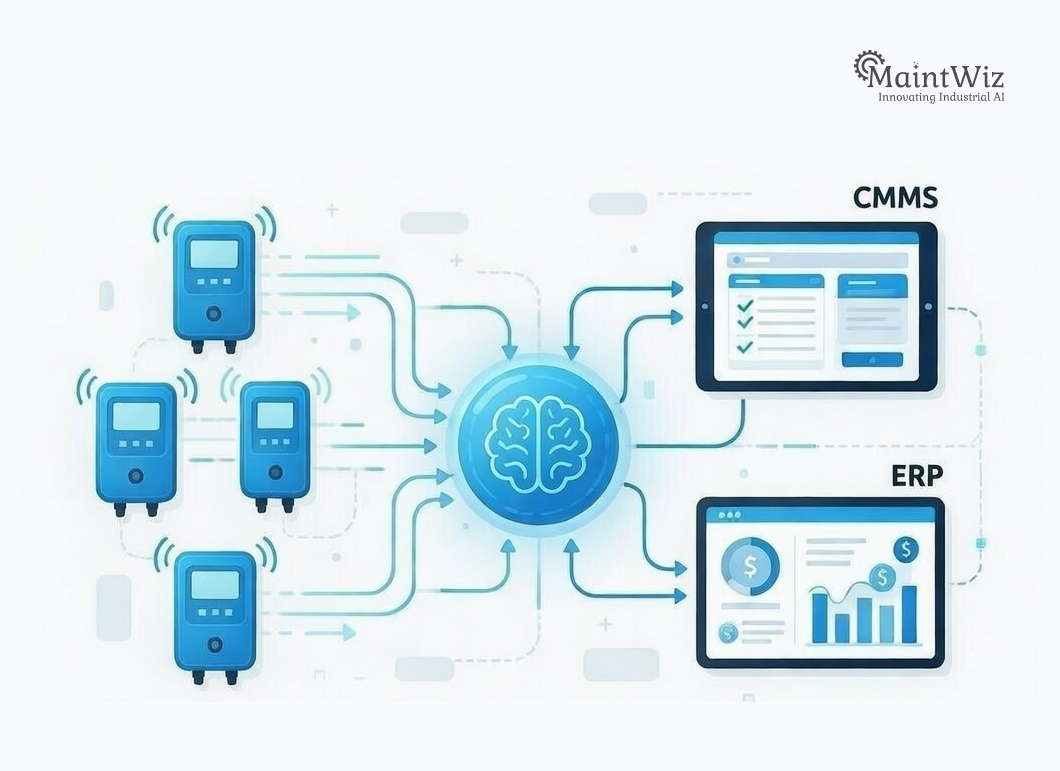
This digital thread connects plant floor to boardroom.
Cultural Shift: From Cost Center to Strategic Asset
Overview
The dashboard didn’t just change metrics.
It changed mindset.
Organizational Transformation
- Maintenance in Executive Reviews
Energy dashboards became standard board slides. - Budget Justification via Energy ROI
Predictive investments supported by measurable savings. - Cross-Functional Alignment
Operations, maintenance, and sustainability collaborated. - Data-Driven Decision Culture
Gut feeling replaced by AI-backed insights.
Energy visibility elevated maintenance credibility.
What Makes MaintWiz AI CMMS Uniquely Positioned
MaintWiz is not just a CMMS.
It is an AI-driven Enterprise Asset Management platform purpose-built for industrial energy-integrated maintenance.
Core Differentiators of MaintWiz AI CMMS
- AI-Powered Predictive Maintenance
Advanced machine learning algorithms detect anomalies early. - Integrated Energy Management Module
Asset-level energy monitoring built into maintenance workflows. - Real-Time Executive Dashboards
Decision-ready visual intelligence. - IoT and ERP Connectivity
Seamless integration across IT/OT stack. - Mobile-First Maintenance Execution
Field teams receive prioritized tasks instantly. - Asset Lifecycle Cost Management
Energy consumption included in lifecycle analysis. - Multi-Site Benchmarking Capability
Compare energy and maintenance performance across plants. - Scalable Enterprise Architecture
Suitable for manufacturing, pharma, utilities, heavy engineering.
MaintWiz brings together reliability engineering, AI analytics, and energy management into a unified platform.
When executives see MaintWiz dashboards, they see:
- Risk mitigation
• Energy efficiency
• Sustainability alignment
• Financial impact
• Competitive advantage
That is why the narrative changes.
The Strategic Question for Industrial Leaders
Ask yourself:
- Can you see real-time energy usage per asset?
- Are energy anomalies automatically triggering maintenance actions?
- Does your CMMS integrate energy data with predictive analytics?
- Can your dashboard influence CFO-level decisions?
- Is sustainability embedded in maintenance operations?
If the answer is no, your organization is likely leaving money — and strategic advantage — on the table.
Final Thought: One Dashboard. One Strategic Shift.
Maintenance will always be essential.
But in a world of rising energy costs, sustainability pressures, and competitive margins, it must become strategic.
Energy is no longer just a utility expense.
It is a diagnostic signal.
A financial lever.
A sustainability driver.
A boardroom conversation starter.
And sometimes, all it takes is one intelligent dashboard to make executives see what they were missing all along.
MaintWiz AI CMMS is designed to power that transformation.


Jai Balachandran is an industry expert with a proven track record in driving digital transformation and Industry 4.0 technologies. With a rich background in asset management, plant maintenance, connected systems, TPM and reliability initiatives, he brings unparalleled insight and delivery excellence to Plant Operations.