OEE Formula Explained: How to Calculate and Improve
Overall Equipment Effectiveness

In today’s highly competitive manufacturing landscape, operational excellence is no longer achieved simply by increasing production capacity or investing in advanced automation. Sustainable competitive advantage comes from maximizing the performance of existing assets while minimizing downtime, quality losses, and production inefficiencies. As manufacturers embrace Industry 4.0, digital transformation, and predictive maintenance, one metric continues to stand above all others as the definitive measure of manufacturing performance—Overall Equipment Effectiveness (OEE).
Whether operating a single production line or managing multiple manufacturing facilities across global locations, plant leaders consistently ask the same question:
“Are our assets performing at their full potential?”
Answering this question requires more than monitoring equipment uptime or tracking production output. Machines may be running, yet still operate below their designed capacity due to speed losses, quality issues, frequent stoppages, or inefficient maintenance practices. Measuring these hidden losses demands a comprehensive performance metric that captures the complete picture of manufacturing effectiveness.
This is precisely why OEE formula calculation has become one of the most important performance measurement methodologies in modern manufacturing.
Originally developed as part of Total Productive Maintenance (TPM), OEE provides a structured framework for measuring how effectively manufacturing equipment converts planned production time into high-quality output. Rather than evaluating maintenance, production, or quality independently, OEE combines these operational dimensions into a single, standardized performance indicator that enables organizations to identify losses, prioritize improvements, and benchmark manufacturing excellence.
Today, OEE has evolved beyond traditional TPM initiatives. Modern manufacturers increasingly integrate OEE with Artificial Intelligence (AI), Industrial Internet of Things (IIoT), Computerized Maintenance Management Systems (CMMS), Manufacturing Execution Systems (MES), and advanced analytics platforms to monitor equipment performance in real time and drive continuous operational improvement.
Organizations that effectively monitor and improve OEE often achieve measurable business outcomes, including:
- Reduced unplanned downtime
- Increased production throughput
- Improved asset utilization
- Higher product quality
- Lower maintenance costs
- Reduced operational waste
- Better production planning
- Increased equipment reliability
- Higher Overall Plant Effectiveness
However, many organizations struggle to calculate OEE accurately. They collect large volumes of production data but fail to transform that information into actionable performance insights. Others calculate OEE correctly yet lack a structured methodology for identifying and eliminating the losses preventing world-class manufacturing performance.
This article provides a comprehensive guide to OEE formula calculation, explaining not only how to calculate Overall Equipment Effectiveness but also how manufacturers can use modern maintenance strategies, digital technologies, and AI-powered CMMS platforms to continuously improve OEE across the entire production environment.
What Is Overall Equipment Effectiveness (OEE)?
Overall Equipment Effectiveness (OEE) is a standardized manufacturing performance metric that measures how effectively production equipment operates compared to its maximum theoretical capability during scheduled production time.
Unlike isolated performance indicators such as uptime or production output, OEE evaluates equipment performance from three interconnected perspectives:
- Availability – Is the equipment available to operate when production is planned?
- Performance – Is the equipment operating at its optimal production speed?
- Quality – Is the equipment consistently producing products that meet quality standards without rework or scrap?
By combining these three dimensions, OEE provides a comprehensive measurement of equipment productivity while exposing the operational losses that reduce manufacturing efficiency.
A machine can appear productive because it remains operational throughout the shift. However, if it experiences frequent micro-stoppages, operates below its rated speed, or produces defective products requiring rework, its actual effectiveness may be significantly lower than expected.
OEE quantifies these hidden losses, enabling manufacturers to focus improvement efforts where they generate the greatest operational and financial impact.
For this reason, OEE is widely recognized as one of the most valuable Key Performance Indicators (KPIs) in manufacturing and forms a cornerstone of TPM, Lean Manufacturing, World Class Manufacturing (WCM), and Industry 4.0 initiatives.
Understanding the OEE Formula Calculation
At its core, Overall Equipment Effectiveness is calculated by multiplying three independent performance factors.
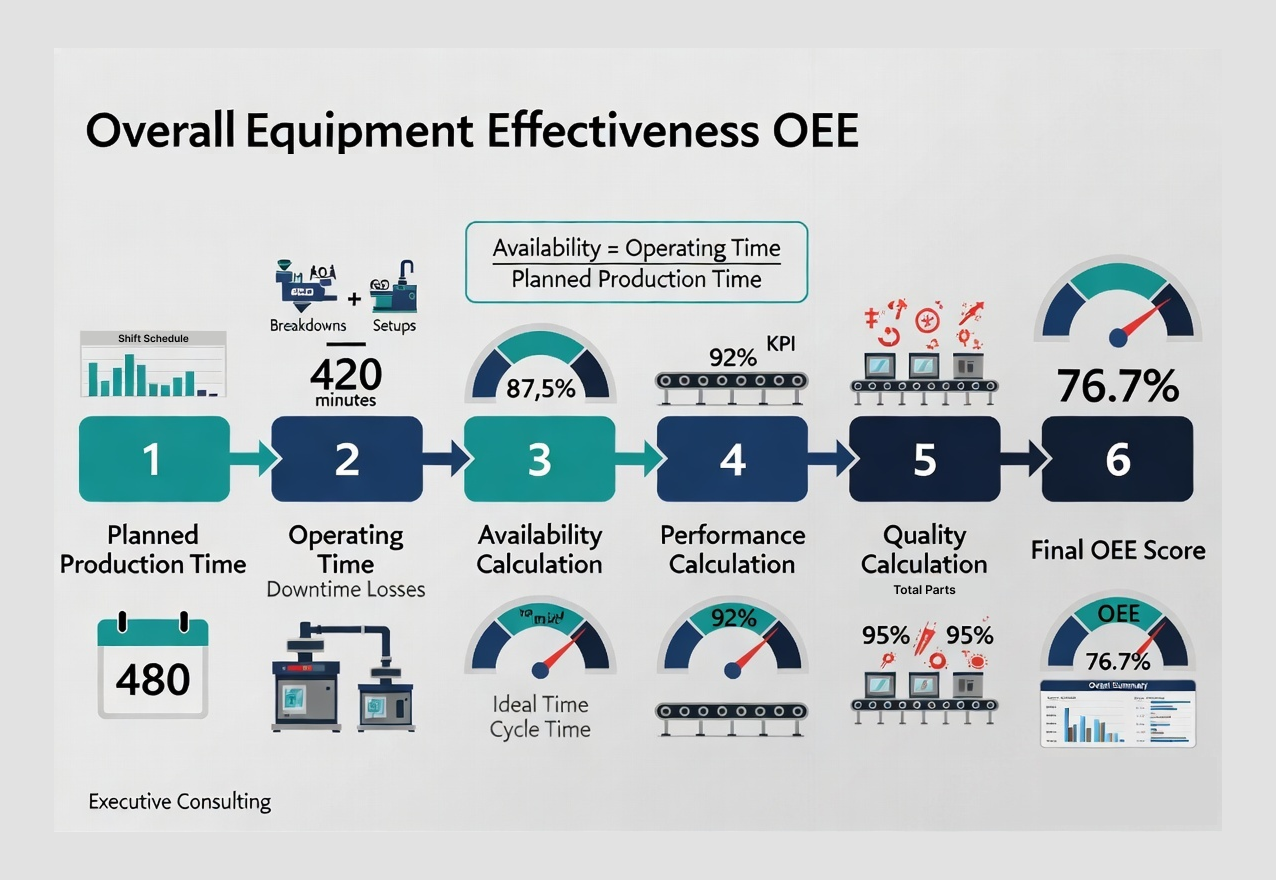
OEE Formula:
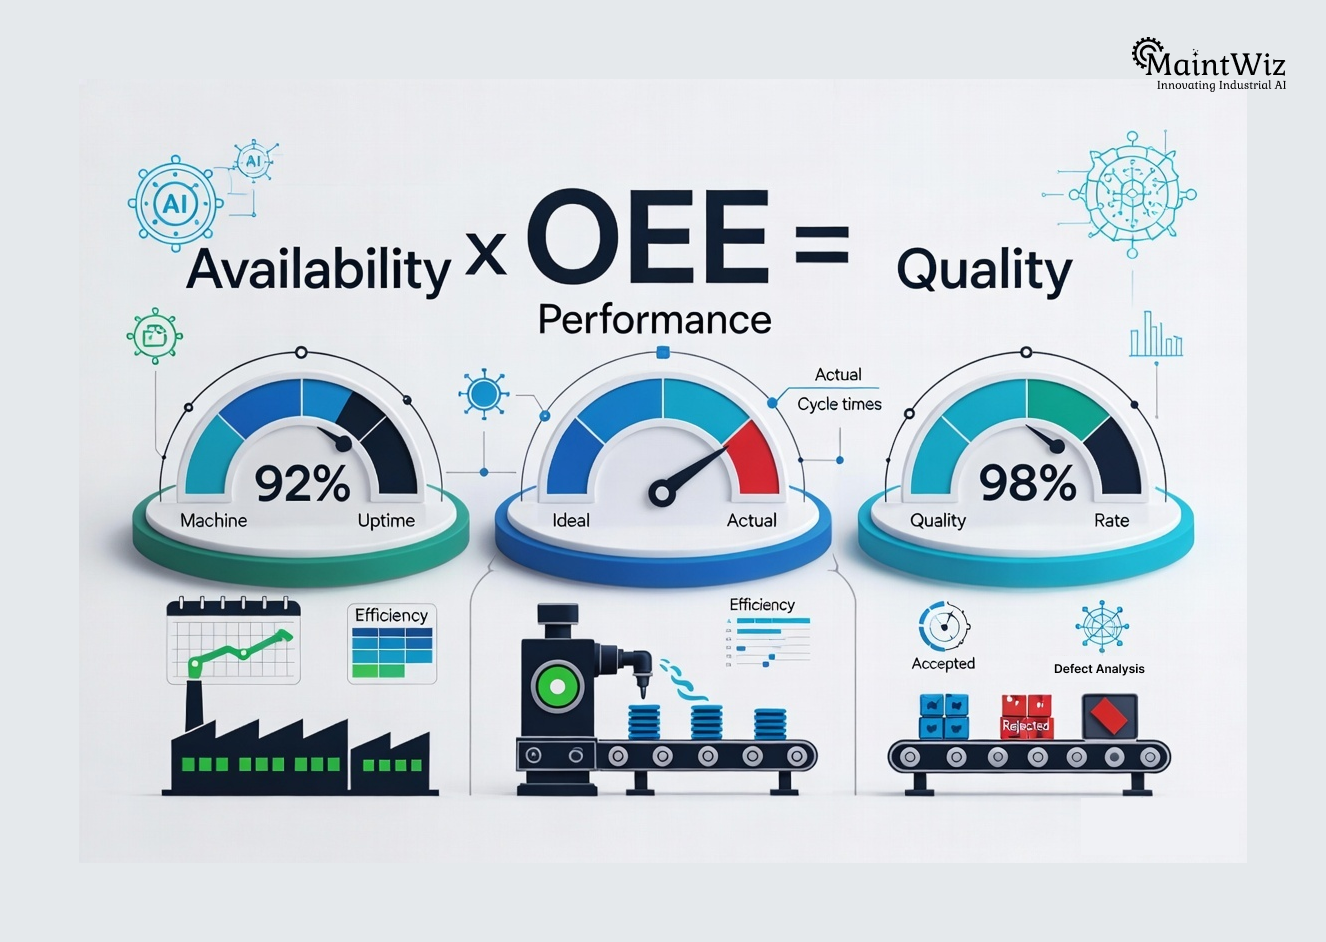
OEE = Availability × Performance × Quality
Each component measures a different aspect of manufacturing effectiveness.
Availability
Availability measures the percentage of scheduled production time during which equipment is actually available for production.
It accounts for all events that stop production, including:
- Equipment breakdowns
- Planned maintenance exceeding scheduled windows
- Emergency maintenance
- Machine setup and changeovers
- Material shortages
- Utility failures
- Operator unavailability
The formula for Availability is:
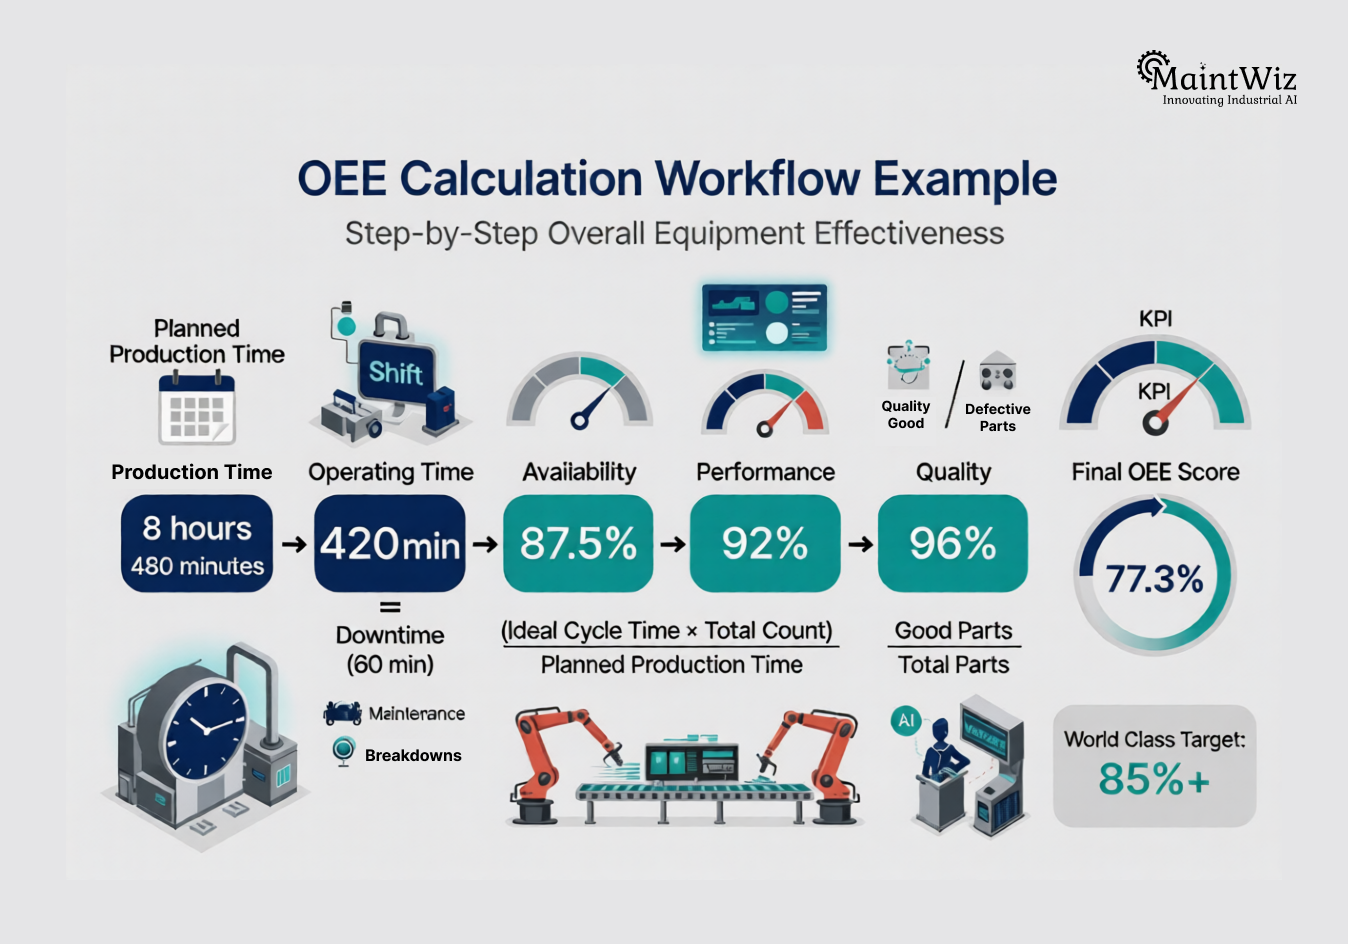
Availability = Operating Time ÷ Planned Production Time × 100
Example
Planned Production Time = 480 minutes
Equipment Downtime = 60 minutes
Operating Time = 420 minutes
Availability = 420 ÷ 480 × 100 = 87.5%
Although the equipment was scheduled to operate for eight hours, only 87.5% of that time was actually available for production.
Performance
Performance measures whether equipment operates at its designed production speed while it is running.
Even when machines remain operational, they frequently produce fewer units than their theoretical maximum due to:
- Reduced operating speeds
- Minor equipment stoppages
- Operator adjustments
- Material inconsistencies
- Equipment wear
- Inefficient machine settings
The formula for Performance is:
Performance = (Ideal Cycle Time × Total Parts Produced) ÷ Operating Time × 100
Example
Ideal Cycle Time = 1 minute per unit
Operating Time = 420 minutes
Total Production = 390 units
Performance = 390 ÷ 420 × 100 = 92.9%
Although the machine was available, it operated below its optimal production speed.
Quality
Quality measures the percentage of products manufactured correctly during the first production cycle without requiring rework or being scrapped.
Quality losses include:
- Defective products
- Scrap
- Rework
- Startup rejects
- Process instability
The formula is:
Quality = Good Parts ÷ Total Parts Produced × 100
Example
Total Production = 390 units
Good Products = 380 units
Quality = 380 ÷ 390 × 100 = 97.4%
Although only ten units failed inspection, they still reduce overall equipment effectiveness because production resources were consumed without creating saleable products.
Complete OEE Formula Calculation Example
Consider a manufacturing facility operating a packaging machine.
| Metric | Value |
|---|---|
| Planned Production Time | 480 min |
| Downtime | 60 min |
| Operating Time | 420 min |
| Ideal Cycle Time | 1 min |
| Total Units Produced | 390 |
| Good Units | 380 |
Step 1 – Calculate Availability
420 ÷ 480 = 87.5%
Step 2 – Calculate Performance
390 ÷ 420 = 92.9%
Step 3 – Calculate Quality
380 ÷ 390 = 97.4%
Final OEE Formula Calculation
OEE = 87.5% × 92.9% × 97.4%
OEE = 79.2%
This means that although the equipment appeared to operate throughout most of the shift, only 79.2% of its total manufacturing potential was converted into good-quality products during scheduled production time.
The remaining 20.8% represents hidden manufacturing losses that can be targeted through maintenance optimization, process improvement, and operational excellence initiatives.
Why OEE Is More Than Just a KPI
Many organizations mistakenly treat OEE as a reporting metric rather than a strategic decision-making tool.
World-class manufacturers use OEE differently.
Instead of simply asking, “What is our OEE?”, they ask:
- Why did OEE decrease this week?
- Which losses contributed most?
- Which production line experienced the greatest decline?
- Which assets consistently underperform?
- What maintenance activities correlate with improved OEE?
- Which recurring failures reduce availability?
- How do quality defects affect equipment effectiveness?
- Which improvement initiatives generate the highest return?
Viewed through this lens, OEE becomes more than a numerical score—it becomes a roadmap for continuous improvement.
By analyzing Availability, Performance, and Quality individually, manufacturers gain actionable insights into where operational inefficiencies exist and how maintenance, production, and engineering teams can collaborate to eliminate them.
Organizations that integrate OEE into daily management practices are better equipped to prioritize investments, optimize maintenance schedules, improve operator performance, and align continuous improvement initiatives with measurable business outcomes.
The Relationship Between OEE and Total Productive Maintenance (TPM)
Overall Equipment Effectiveness did not emerge as an isolated manufacturing metric. It was developed within the framework of Total Productive Maintenance (TPM) as a way to quantify equipment performance and measure the effectiveness of continuous improvement initiatives.
Each of TPM’s eight pillars contributes directly to improving one or more components of the OEE formula.
For example:
- Autonomous Maintenance (Jishu Hozen) improves equipment availability by enabling operators to identify abnormalities early.
- Planned Maintenance reduces unexpected downtime and increases availability.
- Kobetsu Kaizen (Focused Improvement) eliminates chronic losses that reduce performance.
- Quality Maintenance minimizes defects and improves the quality component of OEE.
- Training and Education enhance operator competence, reducing human errors and performance losses.
Rather than viewing OEE as an isolated maintenance KPI, leading manufacturers use it as the common performance metric that aligns maintenance, production, engineering, and quality teams around shared operational goals.
The Six Big Losses: Understanding What Reduces OEE
Calculating Overall Equipment Effectiveness is only the beginning. The real value of OEE formula calculation lies in identifying the operational losses that reduce Availability, Performance, and Quality.
Within the Total Productive Maintenance (TPM) framework, these losses are collectively known as the Six Big Losses. They provide a structured methodology for diagnosing why equipment fails to achieve its maximum productive potential.
Rather than treating every downtime event or quality issue as an isolated problem, the Six Big Losses categorize production inefficiencies into measurable groups, enabling manufacturers to prioritize improvement initiatives based on business impact.
1. Equipment Failures (Breakdowns)
Equipment breakdowns have the most direct impact on Availability. Every unexpected failure interrupts production, increases maintenance costs, disrupts schedules, and often leads to overtime or expedited spare parts procurement.
Common causes include:
- Poor preventive maintenance
- Delayed inspections
- Component wear
- Lubrication failures
- Electrical faults
- Misalignment
- Bearing failures
- Inadequate operator care
Reducing breakdown frequency remains one of the fastest ways to improve OEE.
2. Setup and Adjustment Losses
Production changeovers are essential for manufacturing flexibility, yet they also reduce planned production time.
Long setup durations often result from:
- Manual adjustments
- Tool replacement delays
- Product changeovers
- Trial production
- Calibration activities
Manufacturers applying Single-Minute Exchange of Die (SMED) principles frequently achieve substantial improvements in equipment availability.
3. Minor Stops
Many factories experience dozens—or even hundreds—of short production interruptions each day.
Examples include:
- Material jams
- Sensor interruptions
- Operator resets
- Temporary machine alarms
- Product misfeeds
Although each interruption lasts only a few seconds or minutes, their cumulative impact significantly reduces production performance.
Because these events are often underreported, AI-driven monitoring systems have become increasingly valuable for detecting recurring micro-stoppages.
4. Reduced Speed Losses
Equipment rarely operates continuously at its designed production speed.
Contributing factors include:
- Equipment aging
- Conservative operating settings
- Material inconsistencies
- Operator caution
- Process instability
- Environmental conditions
Performance losses are particularly difficult to identify without continuous production monitoring.
5. Quality Defects
Products requiring rework or disposal consume production capacity without creating customer value.
Common causes include:
- Process instability
- Machine wear
- Calibration issues
- Temperature variation
- Tool deterioration
- Human error
Reducing quality losses directly improves both OEE and manufacturing profitability.
6. Startup Losses
Equipment often produces defective products immediately after startups or changeovers.
These losses typically occur because machines require time to stabilize before achieving optimal operating conditions.
Although frequently overlooked, startup losses can significantly reduce Quality performance in industries involving batch production.
Strategies to Improve Overall Equipment Effectiveness
Improving OEE requires more than increasing production speed or reducing maintenance costs. Since OEE consists of three interconnected factors, improvement efforts must address Availability, Performance, and Quality simultaneously.
Organizations that consistently achieve high OEE focus on eliminating the root causes of equipment losses rather than simply reacting to production issues.
Improving Availability
Availability improves when equipment experiences fewer interruptions during planned production time.
Effective strategies include:
- Implementing preventive maintenance programs
- Introducing predictive maintenance technologies
- Standardizing maintenance procedures
- Improving spare parts management
- Reducing Mean Time to Repair (MTTR)
- Increasing Mean Time Between Failures (MTBF)
- Conducting routine operator inspections
- Applying autonomous maintenance practices
Maintenance planning should transition from reactive repairs toward proactive reliability management.
Improving Performance
Performance increases when equipment consistently operates at its designed production speed.
Manufacturers can improve Performance by:
- Eliminating micro-stoppages
- Optimizing production scheduling
- Reducing changeover time
- Improving operator training
- Standardizing machine settings
- Monitoring production speed in real time
- Eliminating process bottlenecks
Digital production dashboards enable supervisors to identify speed losses as they occur rather than after production has ended.
Improving Quality
Quality improvements require stable production processes supported by consistent equipment performance.
Organizations should focus on:
- Equipment calibration
- Root Cause Analysis (RCA)
- Statistical Process Control (SPC)
- Digital quality inspections
- Automated defect detection
- Standard operating procedures
- Continuous operator training
Reducing quality losses simultaneously improves customer satisfaction, production efficiency, and manufacturing profitability.
Common Mistakes in OEE Formula Calculation
Despite its widespread adoption, OEE is frequently calculated incorrectly.
The most common errors include:
Including Planned Downtime
Breaks, scheduled shutdowns, and planned maintenance should not reduce Availability.
Only unplanned production losses should be included.
Ignoring Minor Stops
Micro-stoppages lasting only a few seconds are often excluded from calculations.
Collectively, these interruptions can significantly reduce Performance.
Using Estimated Production Speeds
Performance should always be calculated using the equipment’s documented Ideal Cycle Time rather than estimated production rates.
Excluding Quality Losses
Manufacturers sometimes measure only machine uptime while ignoring defective products.
Since OEE evaluates overall manufacturing effectiveness, Quality must always be included.
Treating OEE as a Reporting Metric
Perhaps the biggest mistake is viewing OEE as a monthly reporting requirement.
High-performing manufacturers use OEE to drive operational decisions every day.
How AI and IIoT Are Transforming OEE Management
Historically, OEE calculations relied on manually entered production data collected at the end of each shift.
This approach created several challenges:
- Delayed reporting
- Human error
- Incomplete production records
- Limited visibility into recurring losses
Industry 4.0 technologies have fundamentally transformed this process.
Industrial Internet of Things (IIoT) devices continuously monitor equipment conditions, production speed, operating hours, downtime events, and process stability.
Artificial intelligence then analyzes these data streams to identify performance trends and recommend corrective actions before production losses become significant.
Examples include:
- Predicting equipment failures before breakdowns occur
- Detecting recurring micro-stoppages
- Identifying hidden production bottlenecks
- Recommending maintenance schedules
- Forecasting quality deviations
- Prioritizing reliability improvements
Instead of calculating OEE retrospectively, manufacturers can now monitor Overall Equipment Effectiveness continuously in real time.

How MaintWiz CMMS Improves Overall Equipment Effectiveness
Improving OEE requires accurate maintenance data, standardized workflows, and continuous operational visibility. MaintWiz CMMS provides a unified platform that connects maintenance execution, asset performance, production insights, and reliability analytics to support data-driven OEE improvement.
Every maintenance activity—from preventive maintenance schedules and inspection checklists to emergency work orders and predictive maintenance alerts—is recorded against the corresponding asset. This creates a comprehensive equipment history that enables maintenance teams to identify recurring issues affecting Availability, Performance, and Quality.
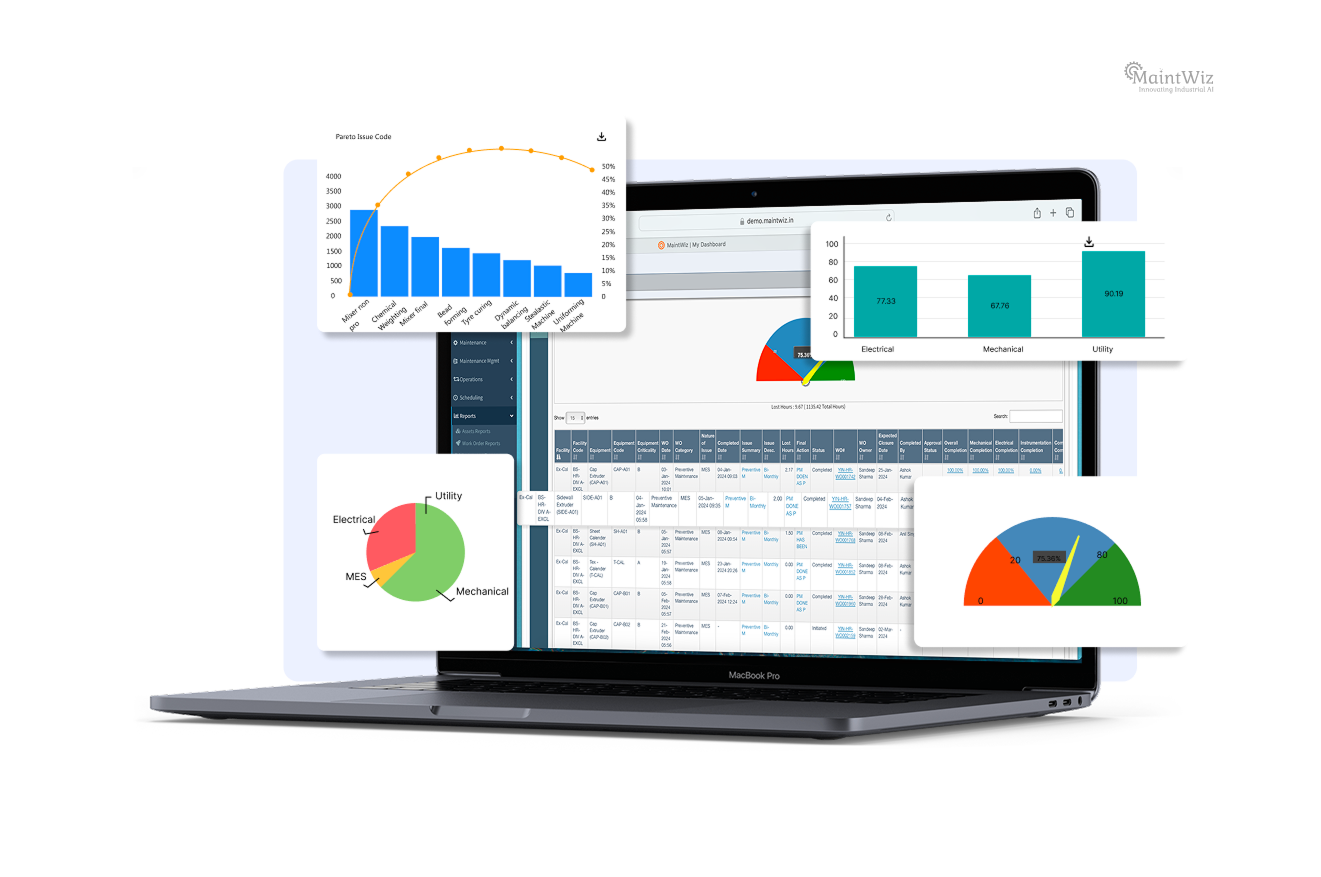
MaintWiz also integrates with IIoT-enabled equipment to capture real-time operational data such as equipment runtime, vibration, temperature, operating hours, and machine health indicators. Combined with AI-driven analytics, these insights help maintenance teams detect emerging performance issues before they impact production.
Interactive dashboards provide plant managers with visibility into OEE trends, asset utilization, maintenance backlog, work order completion rates, and reliability KPIs, enabling faster and more informed decision-making.
Rather than functioning solely as maintenance software, MaintWiz serves as a digital reliability platform that aligns maintenance, production, engineering, and quality teams around a shared objective—maximizing Overall Equipment Effectiveness.
A Practical 90-Day OEE Improvement Roadmap
Organizations seeking measurable improvements in OEE should adopt a phased implementation strategy rather than attempting large-scale transformation all at once.
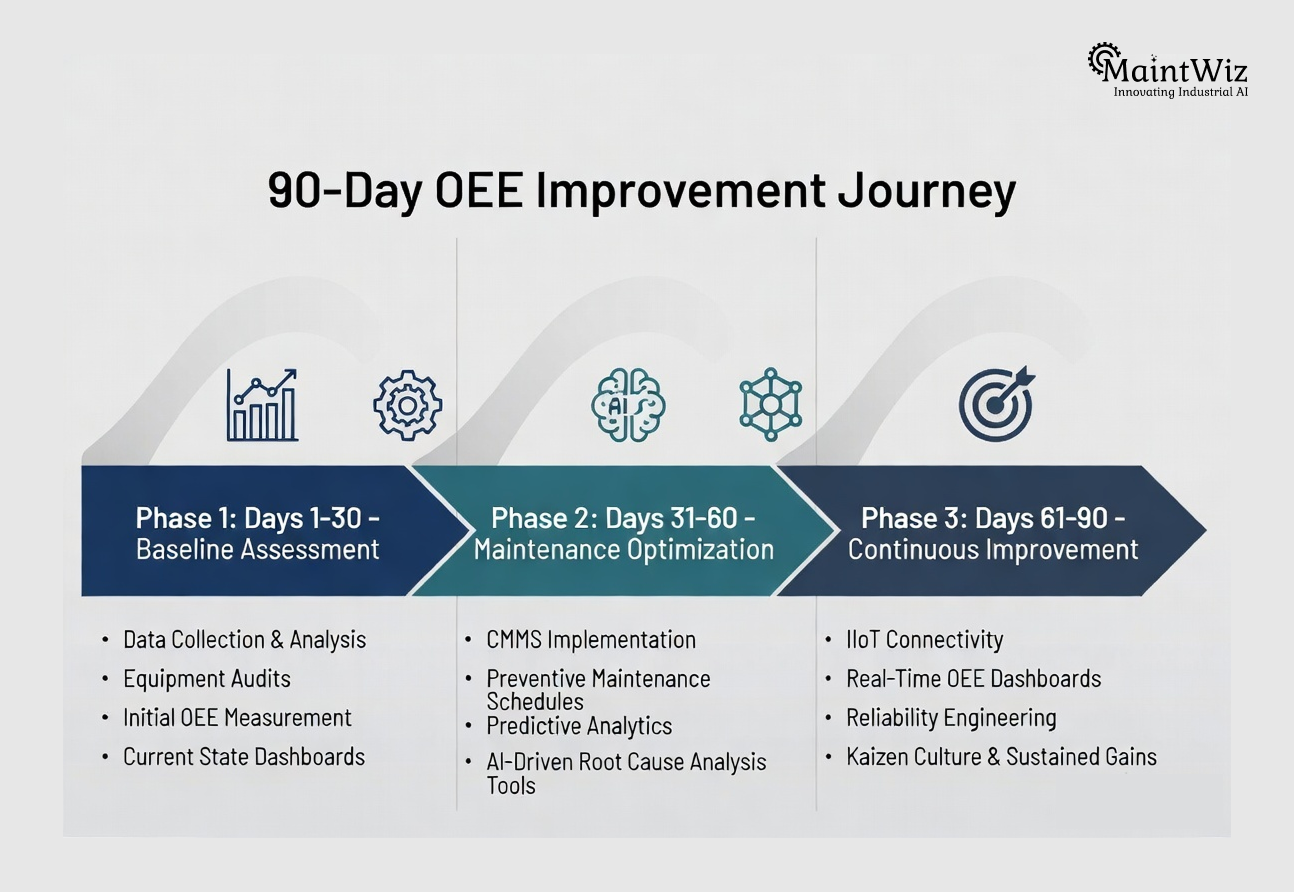
Days 1–30: Establish the Baseline
- Measure current OEE for critical production lines.
- Standardize OEE calculation methods.
- Configure asset hierarchies within the CMMS.
- Digitize maintenance records.
- Identify the largest contributors to the Six Big Losses.
Days 31–60: Improve Maintenance Execution
- Introduce preventive maintenance optimization.
- Enable mobile work order management.
- Deploy digital operator inspections.
- Integrate IIoT sensors for critical assets.
- Begin monitoring equipment health in real time.
Days 61–90: Optimize Through Continuous Improvement
- Analyze recurring production losses.
- Implement AI-supported predictive maintenance.
- Reduce micro-stoppages through focused improvement.
- Monitor OEE dashboards daily.
- Standardize successful maintenance practices across production lines.
This phased approach allows manufacturers to improve OEE progressively while minimizing disruption to ongoing operations.
Conclusion
Overall Equipment Effectiveness remains one of the most powerful indicators of manufacturing performance because it measures what truly matters—the ability of production assets to deliver maximum value during planned production time.
However, calculating OEE is only the first step. Sustainable operational excellence depends on understanding the underlying causes of equipment losses and implementing structured improvement initiatives that address Availability, Performance, and Quality together.
As manufacturing becomes increasingly connected, OEE formula calculation is evolving from a periodic reporting exercise into a real-time operational intelligence capability. AI, IIoT, predictive analytics, and modern CMMS platforms now enable manufacturers to detect losses earlier, optimize maintenance strategies, improve production planning, and make evidence-based decisions that continuously improve asset performance.
Organizations that integrate OEE into their daily management systems—supported by digital maintenance technologies and a culture of continuous improvement—are better positioned to reduce downtime, increase throughput, improve product quality, and strengthen long-term competitiveness.
In the era of Industry 4.0, the manufacturers that achieve world-class OEE will not necessarily own the newest equipment. They will be the organizations that measure performance accurately, eliminate losses systematically, and transform maintenance data into actionable operational intelligence.


Jai Balachandran is an industry expert with a proven track record in driving digital transformation and Industry 4.0 technologies. With a rich background in asset management, plant maintenance, connected systems, TPM and reliability initiatives, he brings unparalleled insight and delivery excellence to Plant Operations.
Company
Download App