
Worked example
Shutdown Case Study: Planned vs Actual Duration and Cost
This worked example follows a generic process plant through one shutdown planned at 16 days that finished in 19. It shows the planned-versus-actual review, scope added after the freeze, permits, the cost performance index and the lessons. Figures are for illustration.
Worked example with illustrative figures. No customer, site or country is described.
How MaintWiz helps: Comparing plan to actual is easy when both are recorded. The MaintWiz shutdown module keeps handover notes, lessons learnt and deferred items with an archive of past shutdowns. See the module · Get the lessons register
By Jai Balachandran · Published · Last reviewed
What MaintWiz adds:Handover notesLessons learntDeferred itemsArchive of past shutdowns
The example
What does a planned versus actual shutdown review look like?
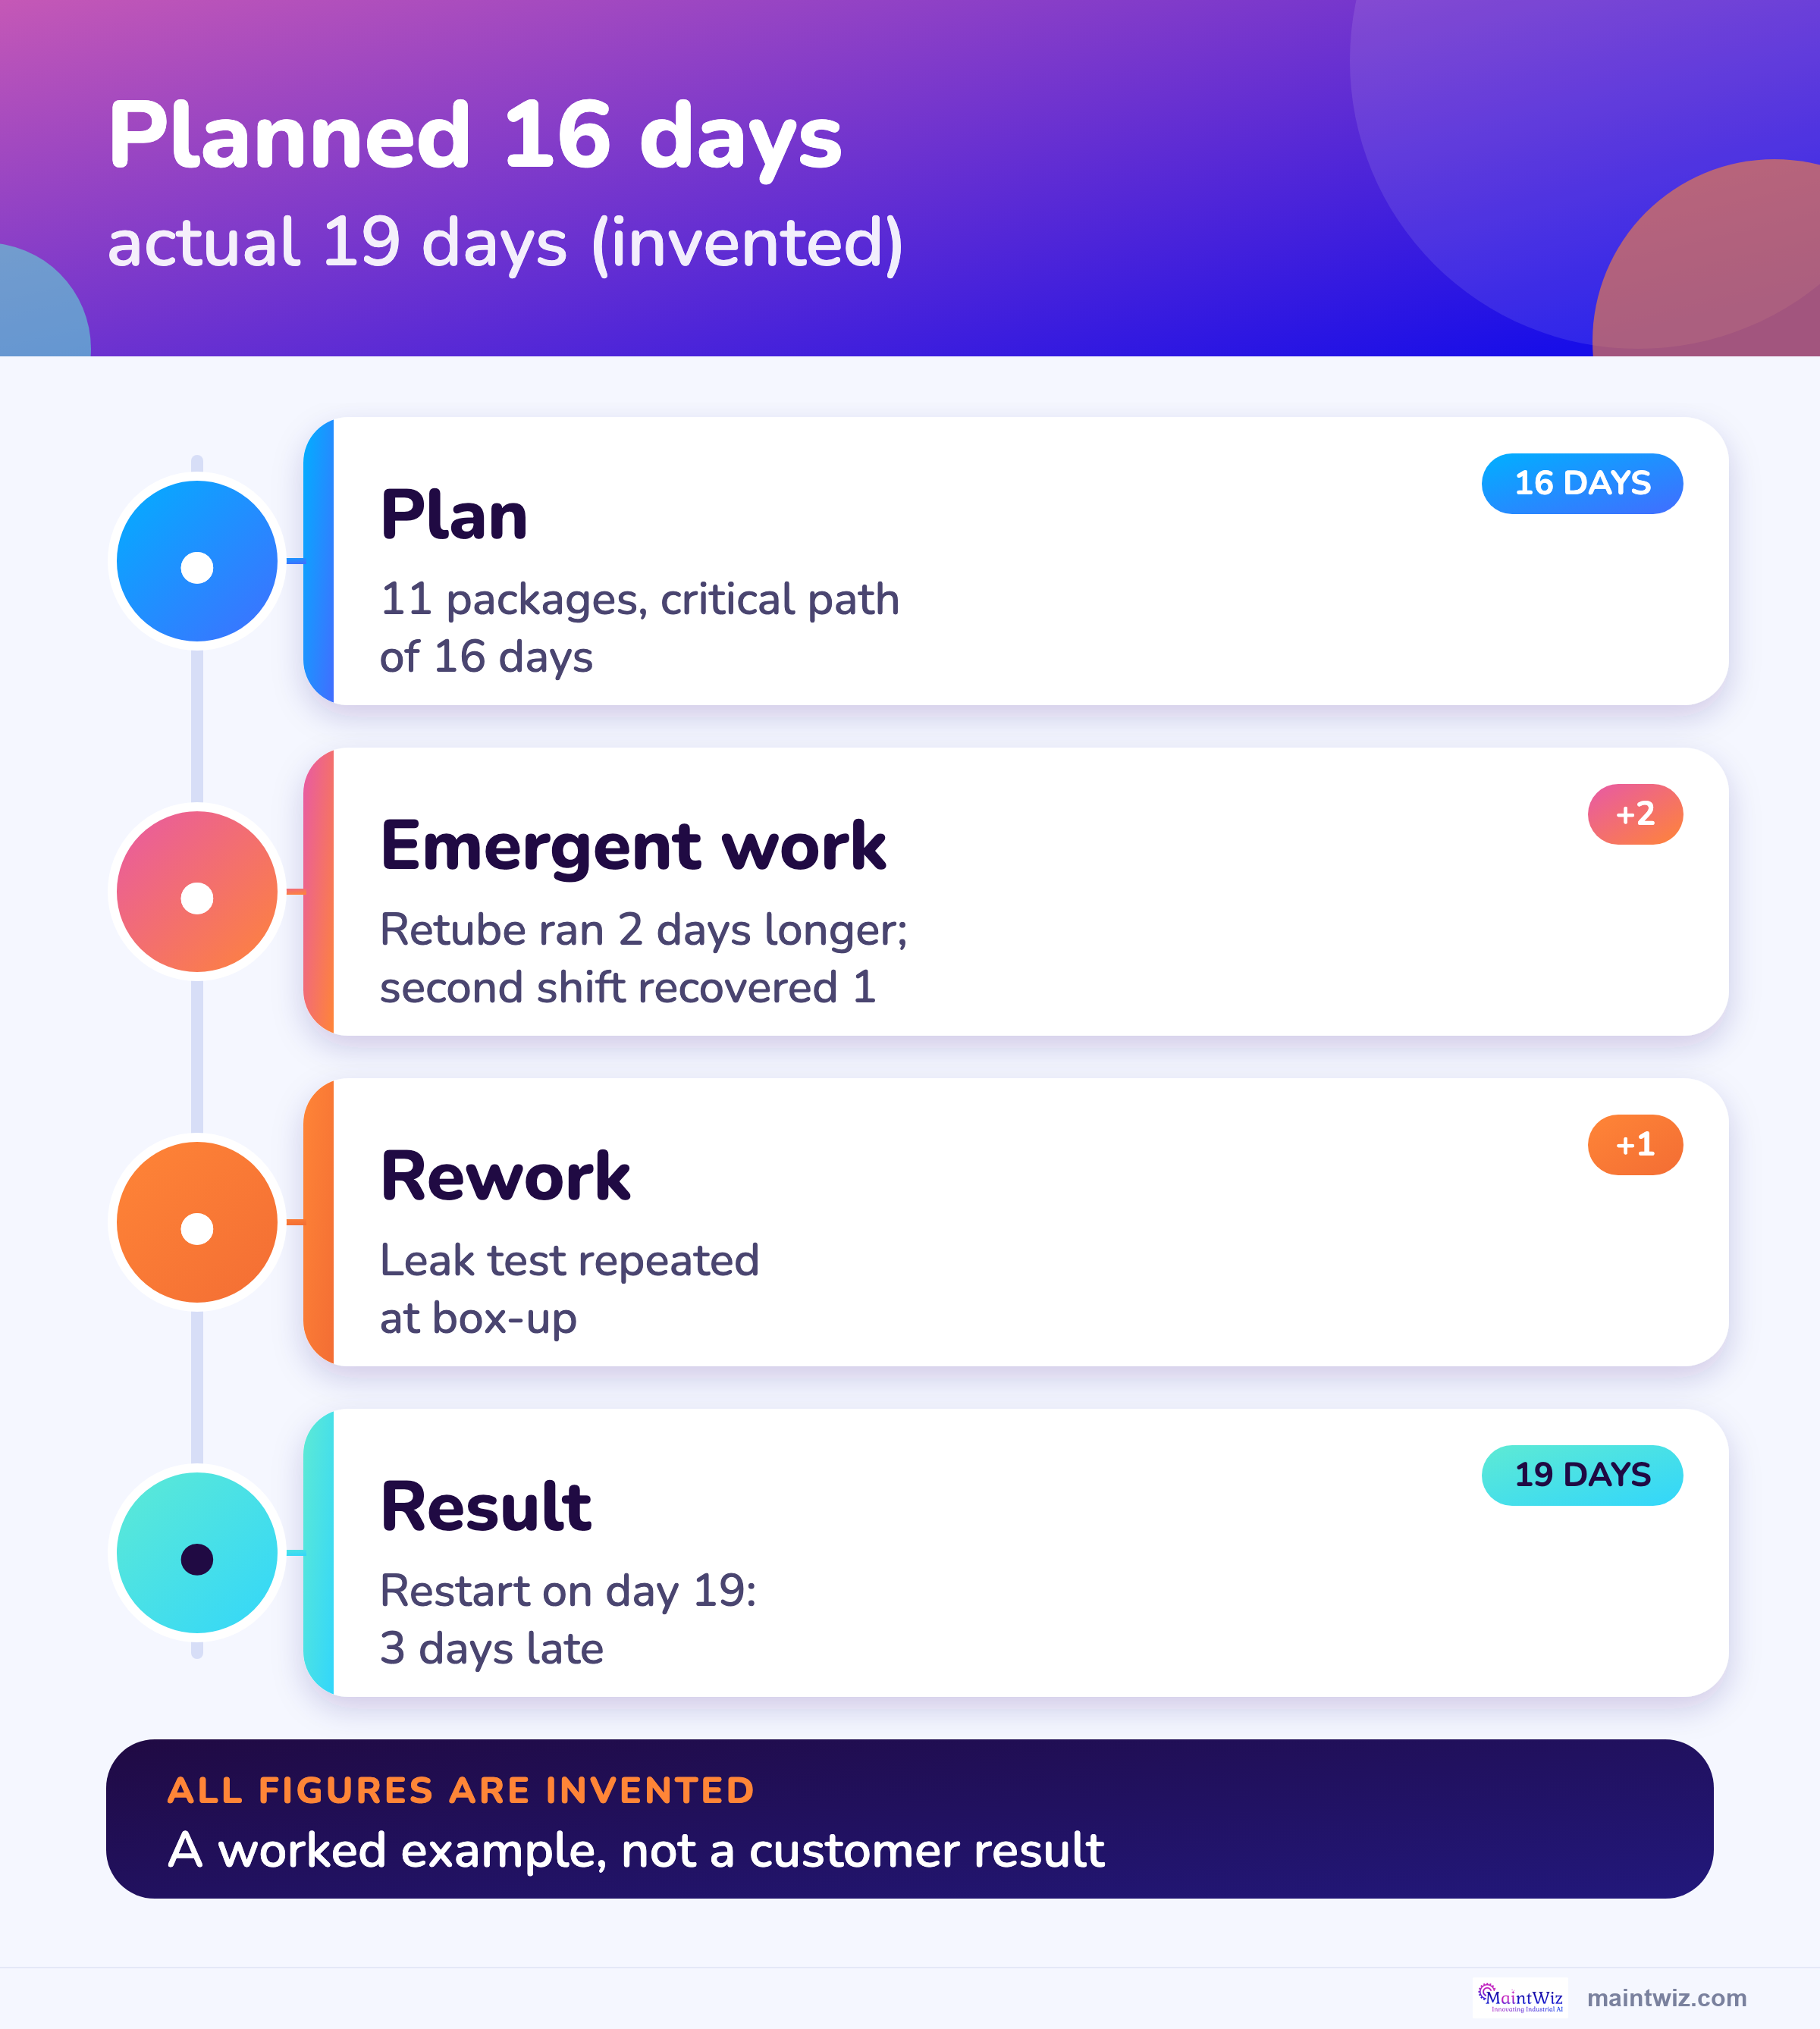
In this worked example a generic process plant planned a 16-day shutdown of 11 work packages and finished in 19 days, 3 days late, because more tubes were found worn at inspection, one valve took a day longer and a leak test had to be repeated; all figures are for illustration. 1
This is a worked example, not a customer result. It follows a generic process plant through one shutdown and every figure is illustrative for the example; it shows the planned-versus-actual review MaintWiz supports and the measures to report.
- 16 to 19 daysPlanned and actual duration (+3 days)
- 23%Scope added after the freeze, approved in writing
- 612Permits issued in the stop
- 0.97Cost performance index at close-out
The plan
How was the shutdown planned?
The team froze the scope at 11 work packages, 1,872 estimated hours, linked them into a schedule and found the critical path A, B, C, D, E, J, K of 16 days, with the pump, valve and instrument work carrying float. 1,2
The critical path is the longest chain of dependent packages; a delay to any of them delays the restart by the same amount, while the other packages can slip by their float without moving it. 2,1 See critical path and float and shutdown scheduling.
Software
Can MaintWiz produce this kind of review for your shutdown?
Yes, in the form of the measures and views described here: the module keeps the plan, the changes, the permits, the parts status and the cost together, so the planned-versus-actual review is a report, not a rebuild.
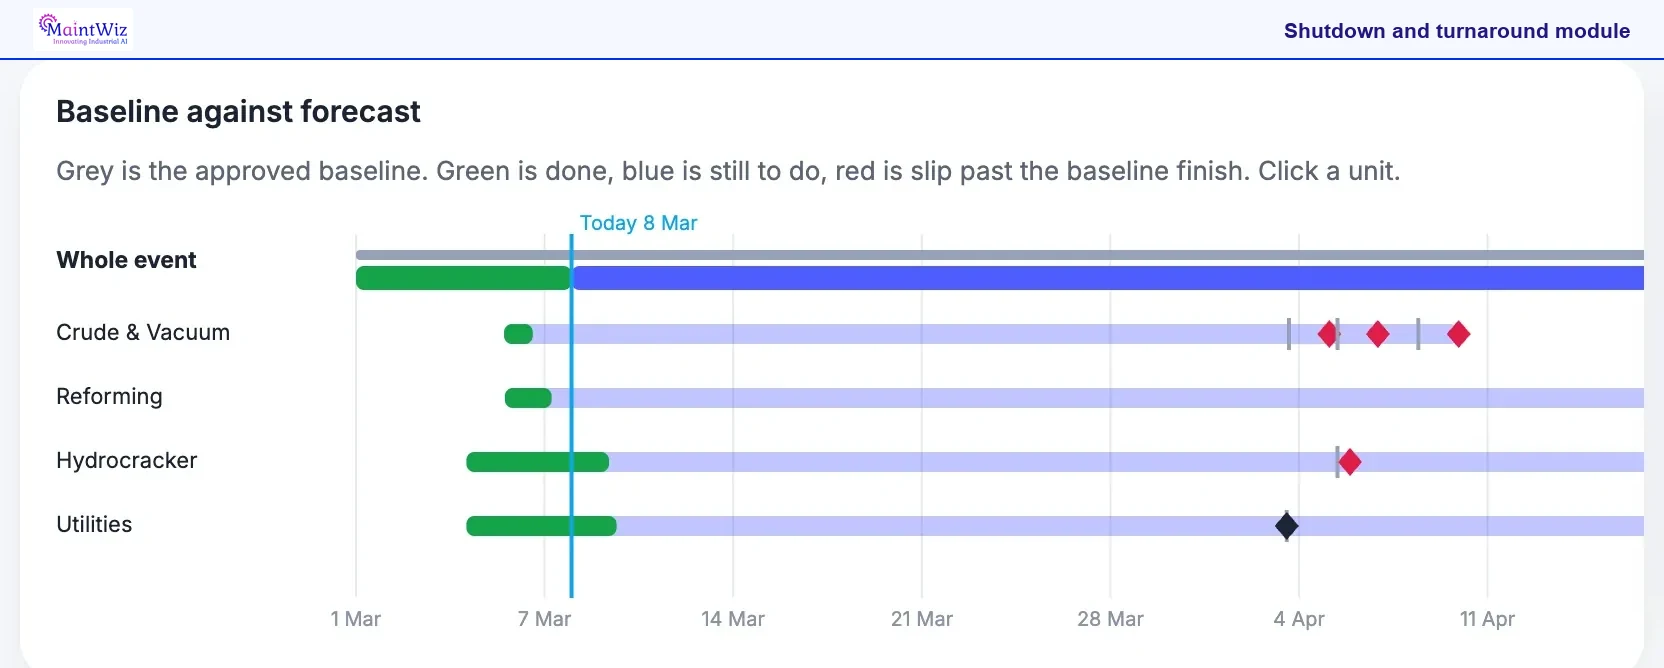
Look at where the red diamonds sit against the grey baseline marks: each shows a milestone forecast to finish later than the baseline. Start with the Whole event row for the overall finish, then check which unit slips the most. That tells the shutdown manager which unit to recover before the stop ends.
| Element | What the screen shows |
|---|---|
| Rows | Whole event, Crude and Vacuum, Reforming, Hydrocracker, Utilities |
| Colours | Grey baseline, green done, blue still to do, red slip past the baseline finish |
| Marker | Today, 8 March in the sample |
Related: Shutdown schedule delays · Shutdown KPIs
What the shutdown module covers
- Gantt chart with critical path and float, and baselines that show what moved
- Scope changes as requests with approvals recorded against the signed-in user
- Permits and isolations from ePTW on each work order
- Needed, in stock and short parts with the SAP status of each short part
- Earned value with cost and schedule indices; budget, actual and forecast per project
- Executive view with decisions ranked by effect in days and money
- Handover, lessons and archive of past shutdowns
Proof
What MaintWiz customers report
Results from MaintWiz customers across maintenance operations.
What happened
What was the planned versus actual duration of the shutdown?
The planned duration was 16 days and the actual duration was 19 days, 3 days or 19 percent late: the retube ran 2 days longer, partly recovered by a second shift, and a leak test had to be repeated for 1 more day, while the valve delay used float and did not move the finish. 1
| Package | Planned days | Actual days | Change | Planned hours | Actual hours | Reason |
|---|---|---|---|---|---|---|
| A Isolate and drain the unit | 2 | 2 | 0 | 96 | 96 | As planned |
| B Open heat exchanger | 1 | 1 | 0 | 48 | 48 | As planned |
| C Clean the bundle | 3 | 3 | 0 | 240 | 240 | As planned |
| D Inspect the exchanger | 2 | 2 | 0 | 96 | 96 | As planned |
| E Retube the exchanger | 4 | 6 | +2 | 640 | 1,000 | More tubes worn; second shift added |
| F Overhaul feed pump | 4 | 4 | 0 | 320 | 344 | Two flange gaskets added |
| G Replace control valve | 2 | 3 | +1 | 96 | 136 | Actuator added; part arrived late |
| H Calibrate instruments | 2 | 2 | 0 | 80 | 80 | As planned |
| I Realign pump and motor | 1 | 1 | 0 | 40 | 40 | As planned |
| J Box up and leak test | 2 | 3 | +1 | 120 | 180 | Leak found, test repeated |
| K Remove isolations and restart | 2 | 2 | 0 | 96 | 96 | As planned |
| Whole shutdown | 16 | 19 | +3 | 1,872 | 2,356 | Critical path moved by 3 days |
Figures are for illustration. Emergent work on the critical path and rework at the end are common patterns that MaintWiz flags early.
Scope
How much work was added after the scope freeze?
Five requests came after the freeze: three were approved in writing for 424 hours, one was deferred and one rejected, so scope grew 22.6 percent against the frozen 1,872 hours, and each approved request carried a reason and an approver. 3
| Request | Description | Reason | Hours | Decision |
|---|---|---|---|---|
| CR1 | More tubes found to be worn at inspection: retube extended | Reliability | 360 | Approved |
| CR2 | Replace the control valve actuator as well | Production | 40 | Approved |
| CR3 | Replace gaskets on two pump flanges | Safety | 24 | Approved |
| CR4 | Repaint the exchanger structure | Other | 120 | Deferred |
| CR5 | Replace instrument cabling | Other | 60 | Rejected |
In generating-unit outage reporting, the original scope of work is fixed in advance and discovery work is not part of it, which is the same logic as a freeze. 3 See scope management for the request form.
Permits
How many permits were issued during the shutdown?
In the example 612 permits were issued over the stop, with a peak of 61 on one day, and at 20 issuer minutes per permit and 360 productive minutes per issuer per shift the peak day needed 4 permit issuers. 5
| Permit type | Issued |
|---|---|
| Cold work | 248 |
| Hot work | 74 |
| Confined space entry | 41 |
| Electrical | 96 |
| Lifting | 58 |
| Work at height | 95 |
| Total | 612 |
Lockout and isolation followed the six steps of OSHA 1910.147(d) for the US example. 5 The issuer count is ceil(61 x 20 / 360) = 4; try your own numbers in the permit issuer calculator on the permit to work guide.
Measures
Which measures should a shutdown review report?
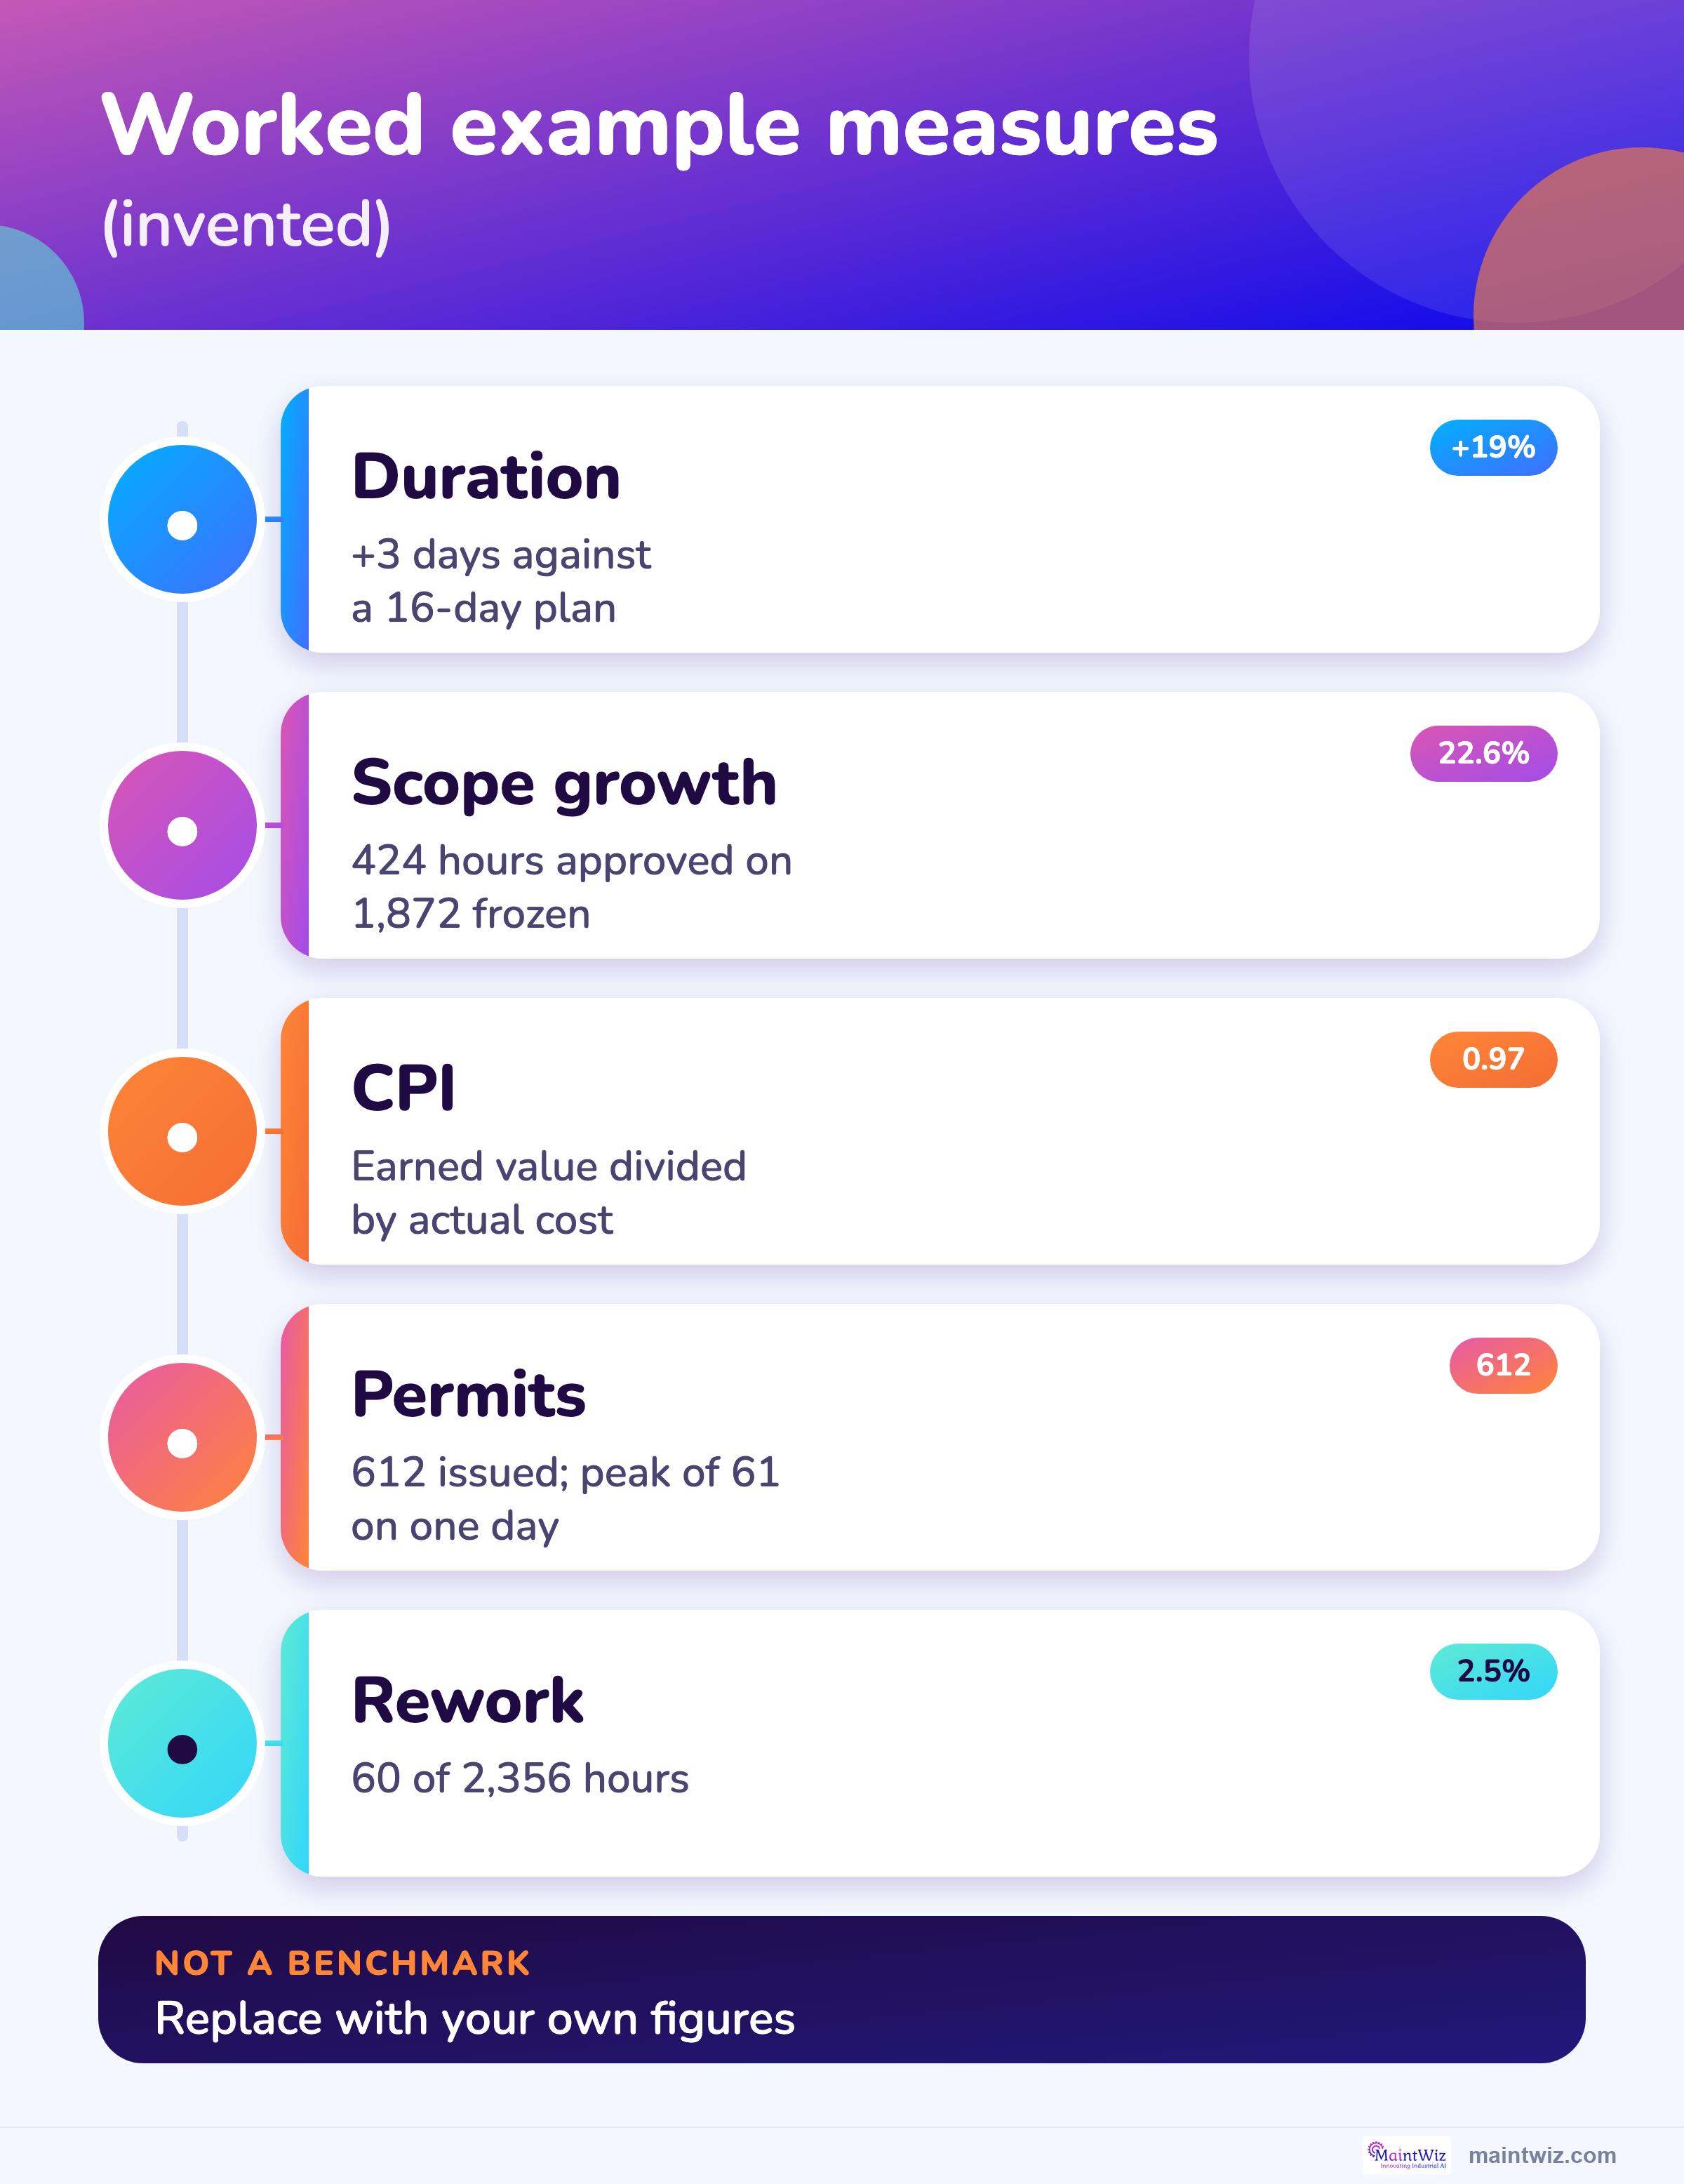
A shutdown review should report duration against plan, scope growth, authorized budget and actual cost, the cost performance index, rework and time on tools; in the example duration was 19 percent over, scope grew 22.6 percent and the cost performance index was 0.97. 2
A free Excel version is available: Planned versus actual review workbook (.xlsx).
| Measure | Plan | Actual | How it is calculated |
|---|---|---|---|
| Duration | 16 days | 19 days | (actual - plan) / plan = 19% |
| Scope growth | 1,872 hours frozen | +424 hours approved | added / frozen = 22.6% |
| Budget | 300,000 baseline | 340,000 authorized | baseline + approved changes |
| Actual cost | 340,000 | 352,000 | cost variance = earned value - actual cost = -12,000 |
| Cost performance index | 1.00 | 0.97 | earned value / actual cost |
| Rework | 0 hours | 60 hours | rework / total hours = 2.5% |
| Time on tools | 60% | 55% | hands-on hours / hours on site (illustrative) |
Cost variance is earned value minus actual cost, and the cost performance index is earned value divided by actual cost; both are defined in the HHS earned value glossary. 2 See the KPI guide; a review workbook with these formulas is in the free shutdown templates.
Decisions
What decisions did the shutdown manager and the executive have to make?
Three decisions shaped the result: approve the extended retube, add a second shift on the retube to recover a day, and defer the repaint, each shown with its effect in days and money so it could be approved or declined on the evidence.
| Decision | Effect shown | Outcome |
|---|---|---|
| Approve the extended retube | +2 days, +36,000 cost | Approved with a written reason |
| Add a second shift on the retube | Recovers 1 day (7 days without it) | Approved |
| Defer the repaint (CR4) | Takes 120 hours off the critical window | Deferred to the next stop |
The decisions and effects are for illustration.
Lessons
What should the plant change before the next shutdown?
The review turns each deviation into an action with an owner: inspect tubes before the freeze, receive long-lead parts before it, hold a pre-test check and a test slot, and pre-agree approval limits for added work, which is how a lesson becomes a change to the next plan. 4
| Finding | Action | Owner |
|---|---|---|
| Tube condition was not known before the freeze | Add a tube inspection before the next freeze and carry a retube allowance | Reliability engineer |
| Control valve part arrived after the stop began | Receive long-lead parts before the freeze, not only order them | Materials planner |
| Leak test failed on first attempt | Add a pre-test check at box-up and hold the test slot with float | Area lead |
| Added work needed a decision within hours | Pre-agree approval limits for scope changes | Shutdown manager |
The DOE lessons learned standard describes a lesson as a good practice or an adverse experience that is captured and shared, and says lessons programs need identification, documentation, validation, dissemination and use. 4 See the lessons learned guide and shift handover practice from HSE. 6
In MaintWiz
How would a plant run this shutdown in MaintWiz?
A plant would plan the stop in the shutdown module with a baseline and the critical path, control scope through requests with recorded approvals, tie permits and isolations to each work order, show SAP status for short parts, track cost and progress, and decide with the executive view.
| Step | What the shutdown module provides |
|---|---|
| Plan and baseline | Gantt chart with critical path and float; baselines that show what moved |
| Scope control | Findings from work orders go to the planner as requests for added work; approvals are recorded against the signed-in user with a name and time |
| Permits and isolations | ePTW permits and isolations shown on each work order; a package with an open permit cannot be closed |
| Parts | Needed, in stock and short, with the SAP status of each short part |
| Cost and progress | Planned, earned and actual cost with the cost and schedule indices; budget, actual and forecast per project |
| Executive decisions | Health matrix and decisions ranked by effect in days and money, with Approve and Decline |
| Close-out | Handover note, as-left summary, lessons and archive of past shutdowns |
See the shutdown management software page, the MaintWiz shutdown module data sheet and the module FAQ. Capabilities listed are those of the current module; planned items are on those pages.
Visuals
Save the case study charts
Two charts from the worked example. Click either for the full-size image.
FAQ
Frequently asked questions
Is this a real customer case study?
This is a worked example with illustrative figures that shows how MaintWiz supports a planned-versus-actual review. Ask for a demo to see it on your own shutdown.
What was the planned versus actual duration in the example?
Planned 16 days, actual 19 days: 3 days or 19 percent late. Figures are for illustration.
How much work was added after the scope freeze in the example?
424 approved hours on a frozen 1,872 hours, which is 22.6 percent; one request was deferred and one rejected.
How many permits were issued in the example?
612, with a peak of 61 on one day, which needed 4 permit issuers at 20 issuer minutes per permit.
Which measures does the example report?
Duration against plan, scope growth, authorized budget and actual cost, the cost performance index (0.97), rework and time on tools. 2
What is the critical path?
The longest chain of dependent tasks; a delay to any task on it delays the finish by the same amount. 2,1
How can I run a review like this?
Use the planned versus actual review workbook and the KPI guide.
Will you publish a real case study?
Sources
Sources
The schedule, earned value, outage scope, lessons learned, lockout and shift handover references come from the sources below.
- US Government Accountability Office, GAO Schedule Assessment Guide: Best Practices for Project Schedules (GAO-16-89G, December 2015)
- US Department of Health and Human Services, Earned Value Management, Appendix D: Glossary of Terms
- North American Electric Reliability Corporation, Generating Availability Data System (GADS) Data Reporting Instructions, effective 1 January 2026
- US Department of Energy, DOE-STD-7501-99, The DOE Corporate Lessons Learned Program
- OSHA, 29 CFR 1910.147, The control of hazardous energy (lockout/tagout)
- UK Health and Safety Executive, Human factors: Shift handover
Turn this shutdown into the next one's plan
Book a demo and bring your last close-out report. We will show how the module keeps lessons and deferred items.