
Key takeaways
- OEE = availability x performance x quality: the share of planned production time that produced good output at the ideal rate.
- MaintWiz, an AI CMMS built for TPM, shows OEE per equipment with loss stratification, a daily view and a lost-hours Pareto, rolled up to line and plant by planned time.
- 85% is the widely cited world-class OEE figure: 90% availability x 95% performance x 99% quality (84.6%), set for high-volume discrete lines; track your own trend toward it on a fixed definition.
- Roll OEE up by adding times, not by averaging percentages; treat any factor above 100% as a data error.
Definition
What is OEE? Full form and meaning
OEE stands for overall equipment effectiveness. It multiplies three ratios: availability, the share of planned production time the equipment ran; performance, the rate achieved against the ideal rate while running; and quality, the share of output good first time. Seiichi Nakajima set out OEE as part of TPM (Ahuja and Khamba 2008). Some sources write overall equipment efficiency; the calculation is the same.
In plain words: of 100 minutes planned for production, how many made good parts at full speed? If 10 minutes were lost to stops, 10 to slow running and 5 to bad parts, OEE is 75%. In manufacturing the value is in the losses it separates, each with its own causes and owners. 100% would mean good parts only, at full speed, with no stops. OEE is used in lean and six sigma work too. In Total Productive Maintenance it shows the losses the pillars work on: autonomous and planned maintenance on availability, focused improvement on all three factors, quality maintenance on quality. In the OEE vs TPM pairing, OEE is the measure and TPM is the system that works on the losses it shows.
Downloads
Free OEE files: formula cheat sheet, roll-up and shift sheet
 PDFOEE formula cheat sheet
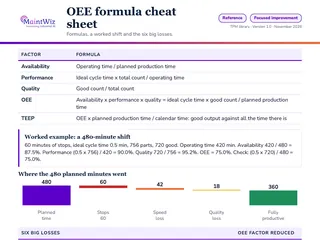
Keep the OEE formulas, a worked 480-minute shift, the six big losses and the 16 major losses on one printable page
- Pages
- 1
- A4
- Created
- 5 November 2026
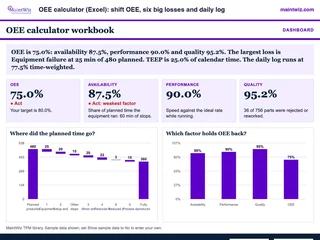 ExcelOEE calculator (Excel): shift OEE, six big losses and daily log
Type one shift and see OEE, the three factors and where every planned minute went
- Sheets
- Dashboard, Shift calculator, Daily log, 480 min shift, Two products in one shift, Read me
- A4
- Version
- v1.1, 5 November 2026
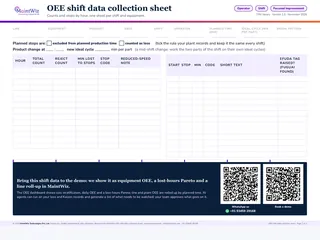 PDFOEE shift data collection sheet
Print one sheet per shift and equipment: hourly counts, a coded stop log, efuda tag column and a product change line
- Pages
- 2
- A4 landscape
- Created
- 5 November 2026
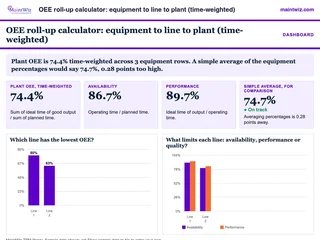 ExcelOEE roll-up calculator: equipment to line to plant (time-weighted)
Roll equipment OEE up to line and plant by planned time
- Sheets
- Dashboard, Inputs, Equipment, Line, Plant, Bottleneck line OEE, Why weighted, Totals, Read me
- A4
- Version
- v1.1, 5 November 2026
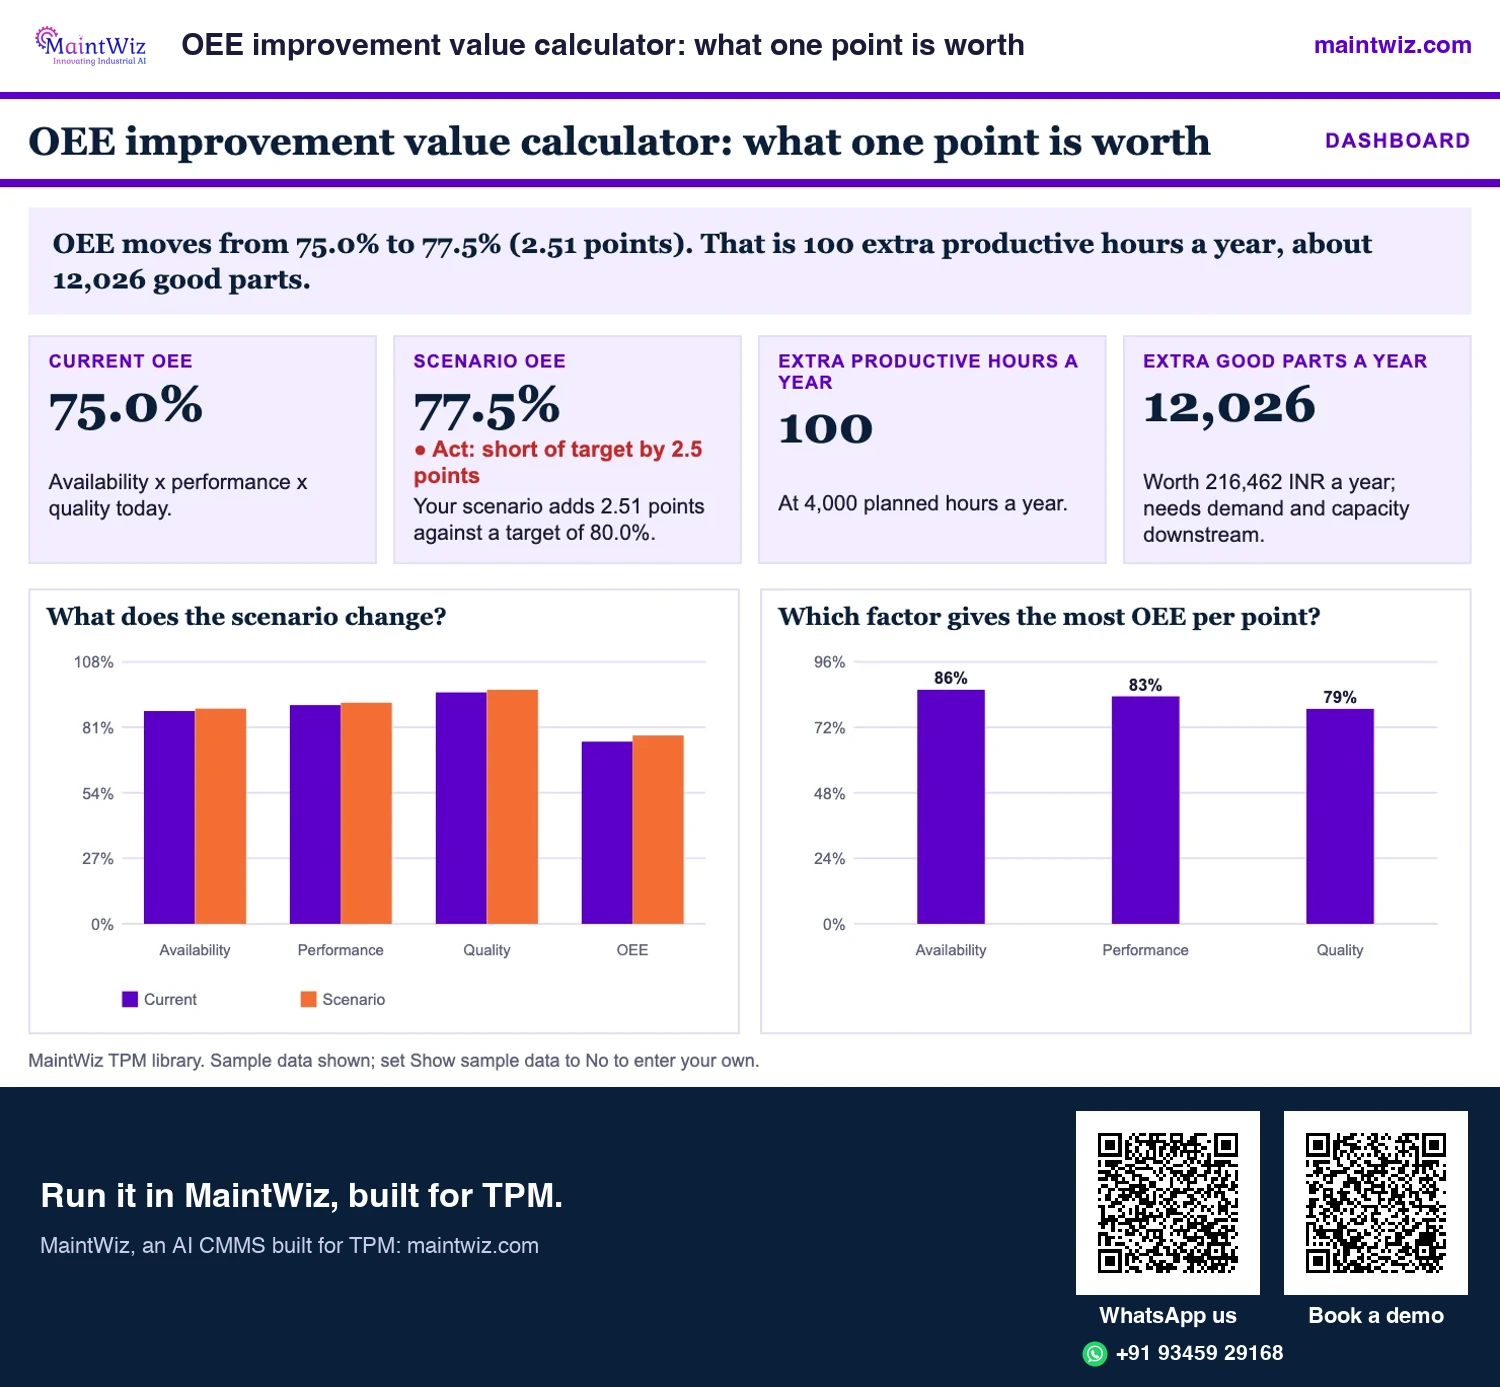
 ExcelOEE improvement value calculator: what one point is worth
See what one point of availability, performance or quality is worth in hours and good parts
- Sheets
- Dashboard, What-if, Read me
- A4
- Version
- v1.0, 2 November 2026
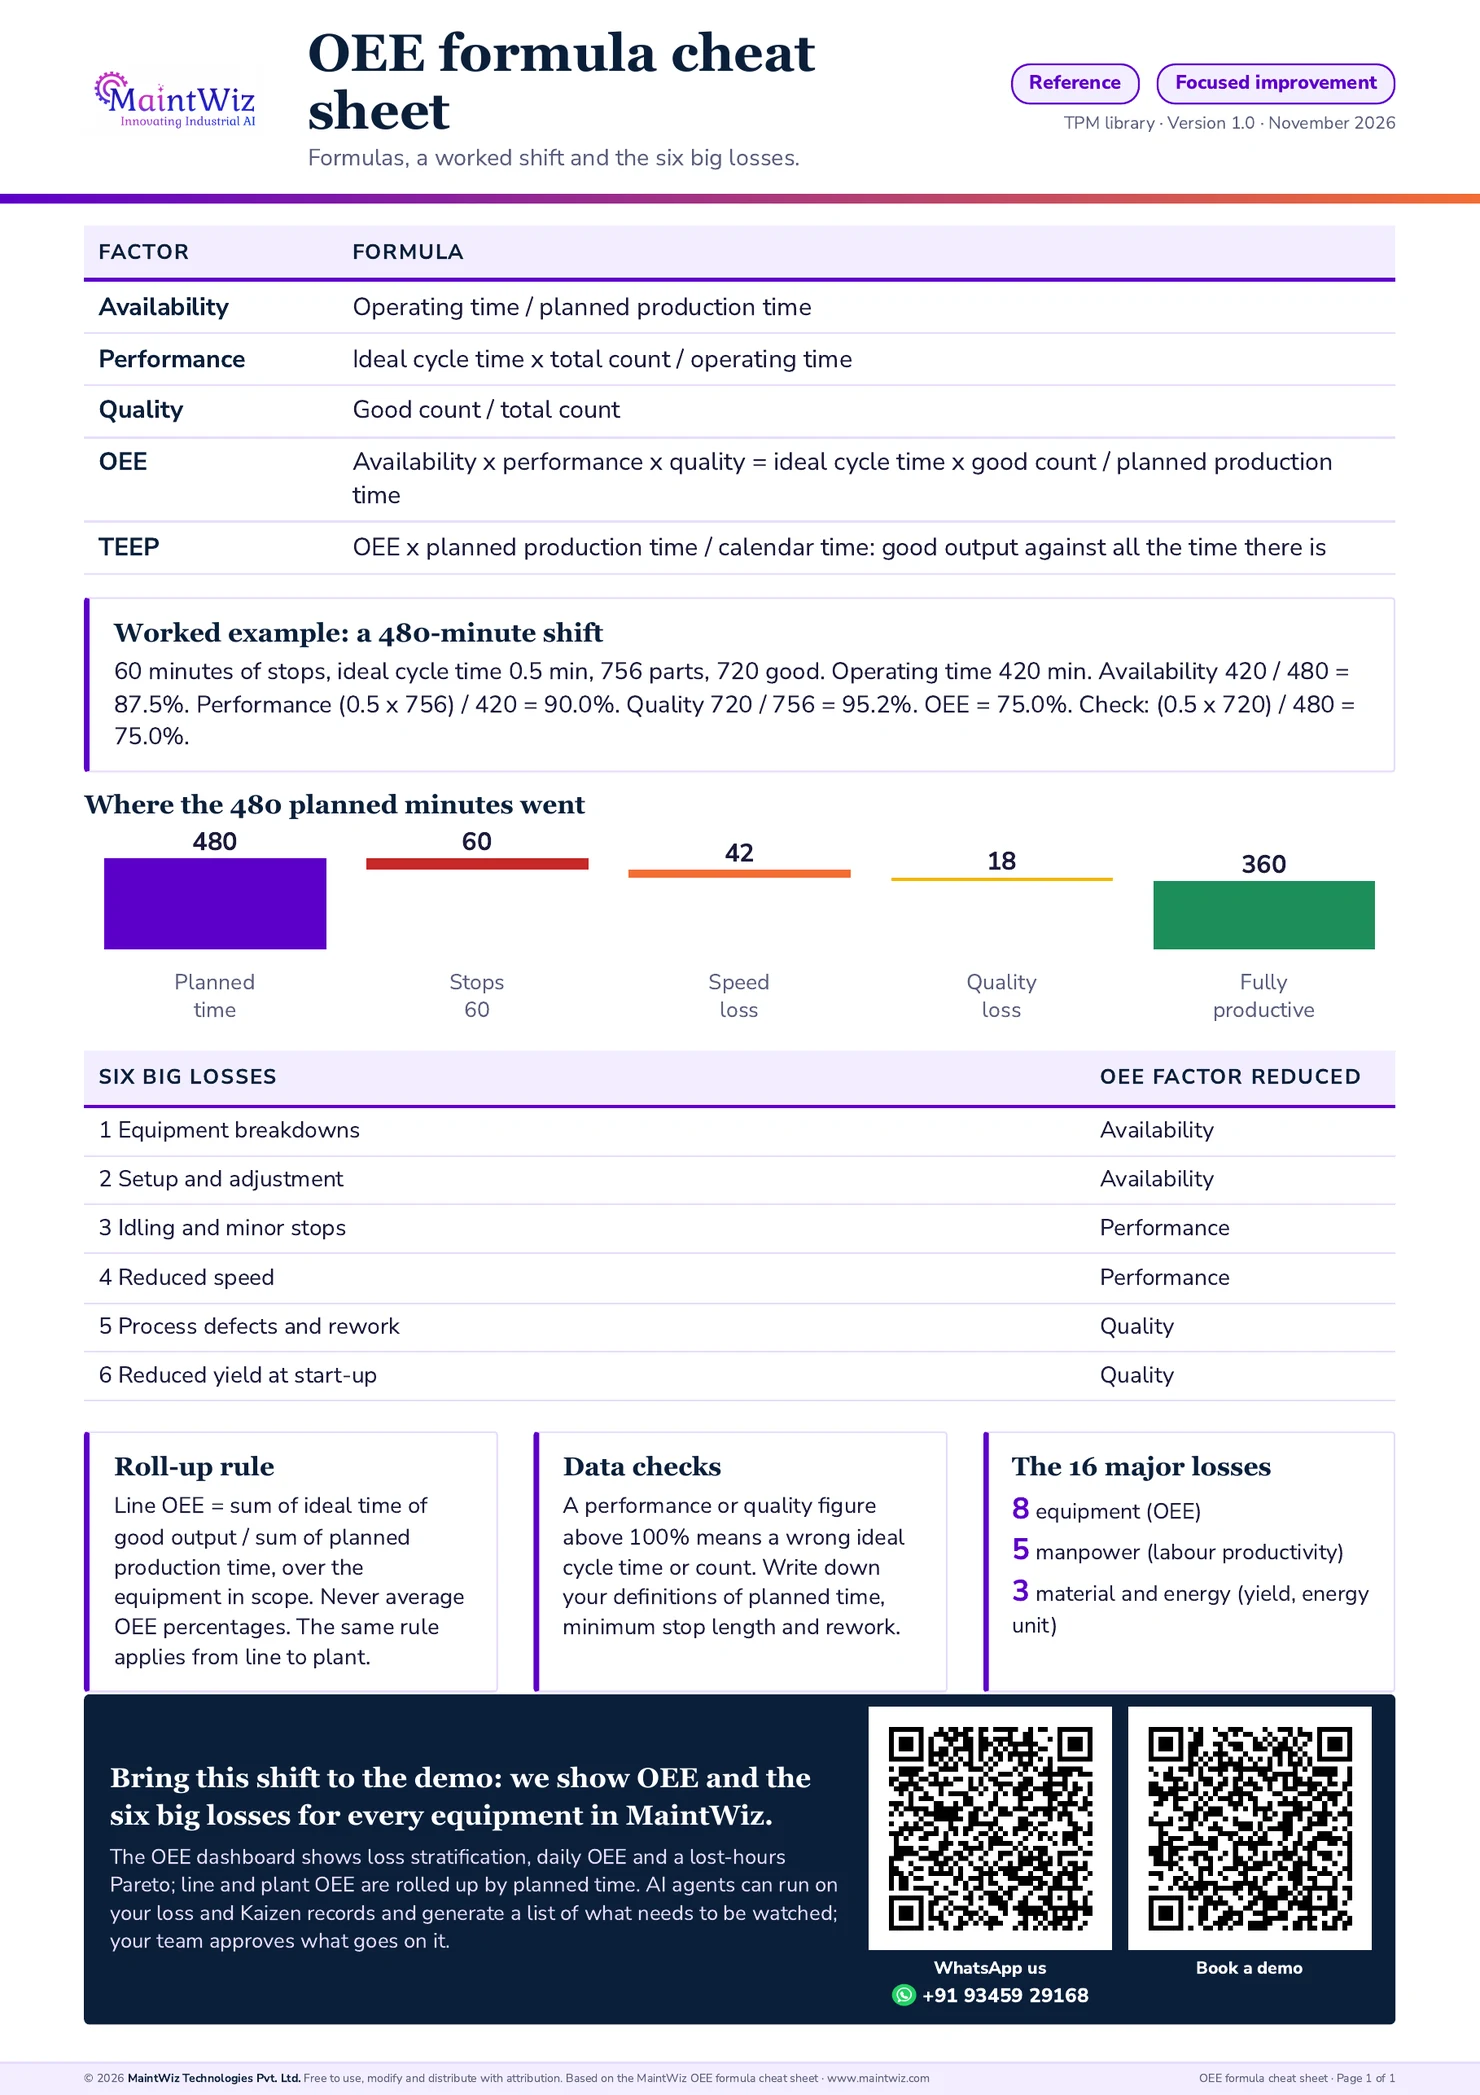
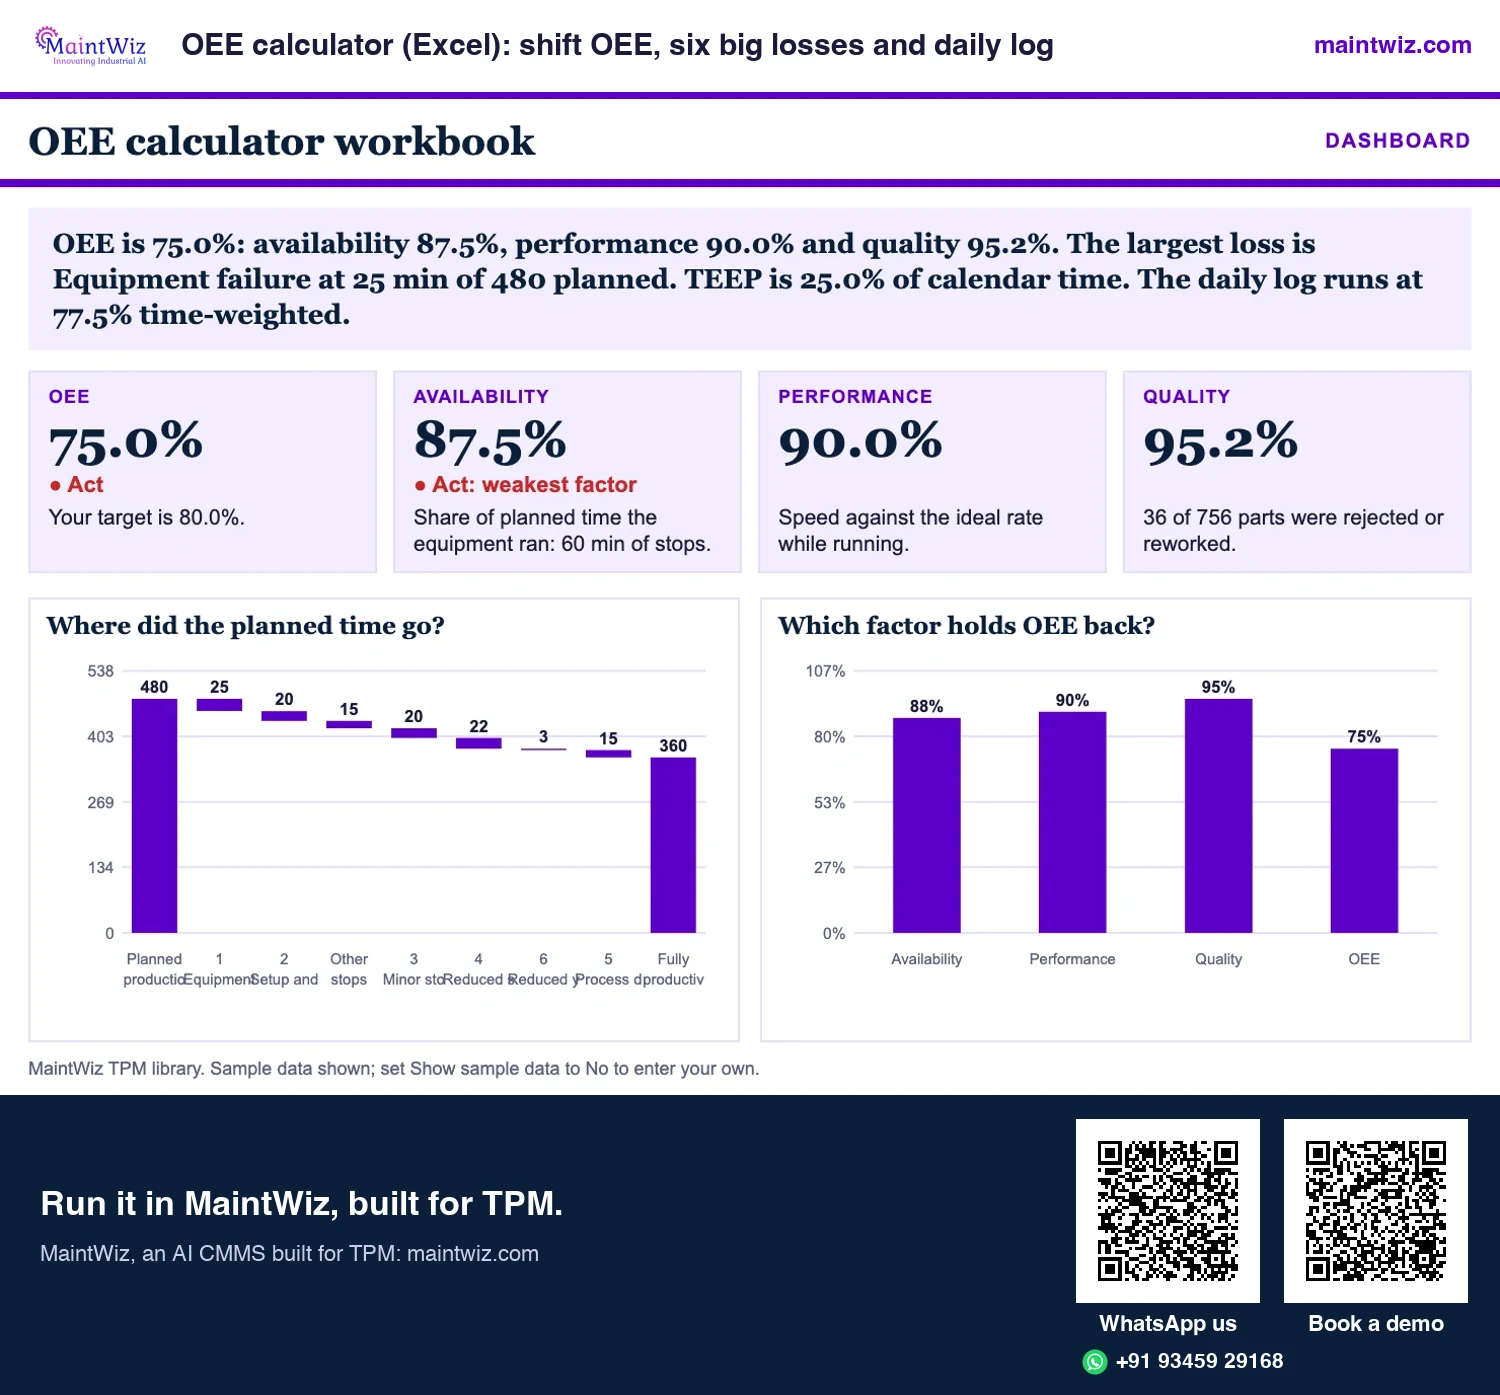
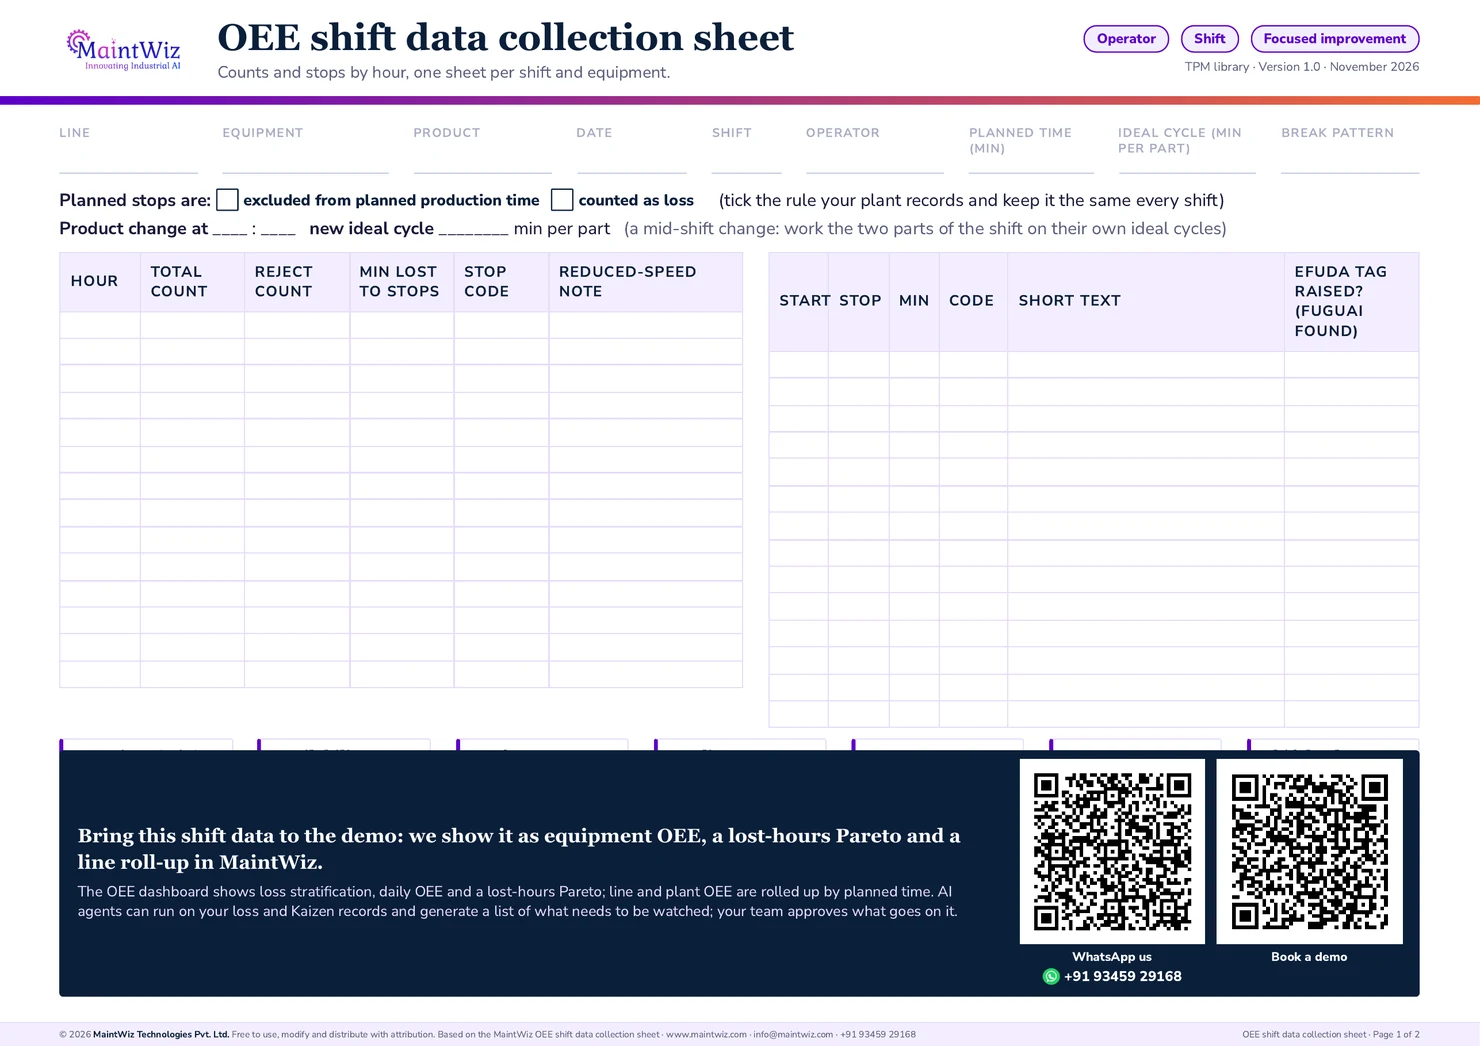
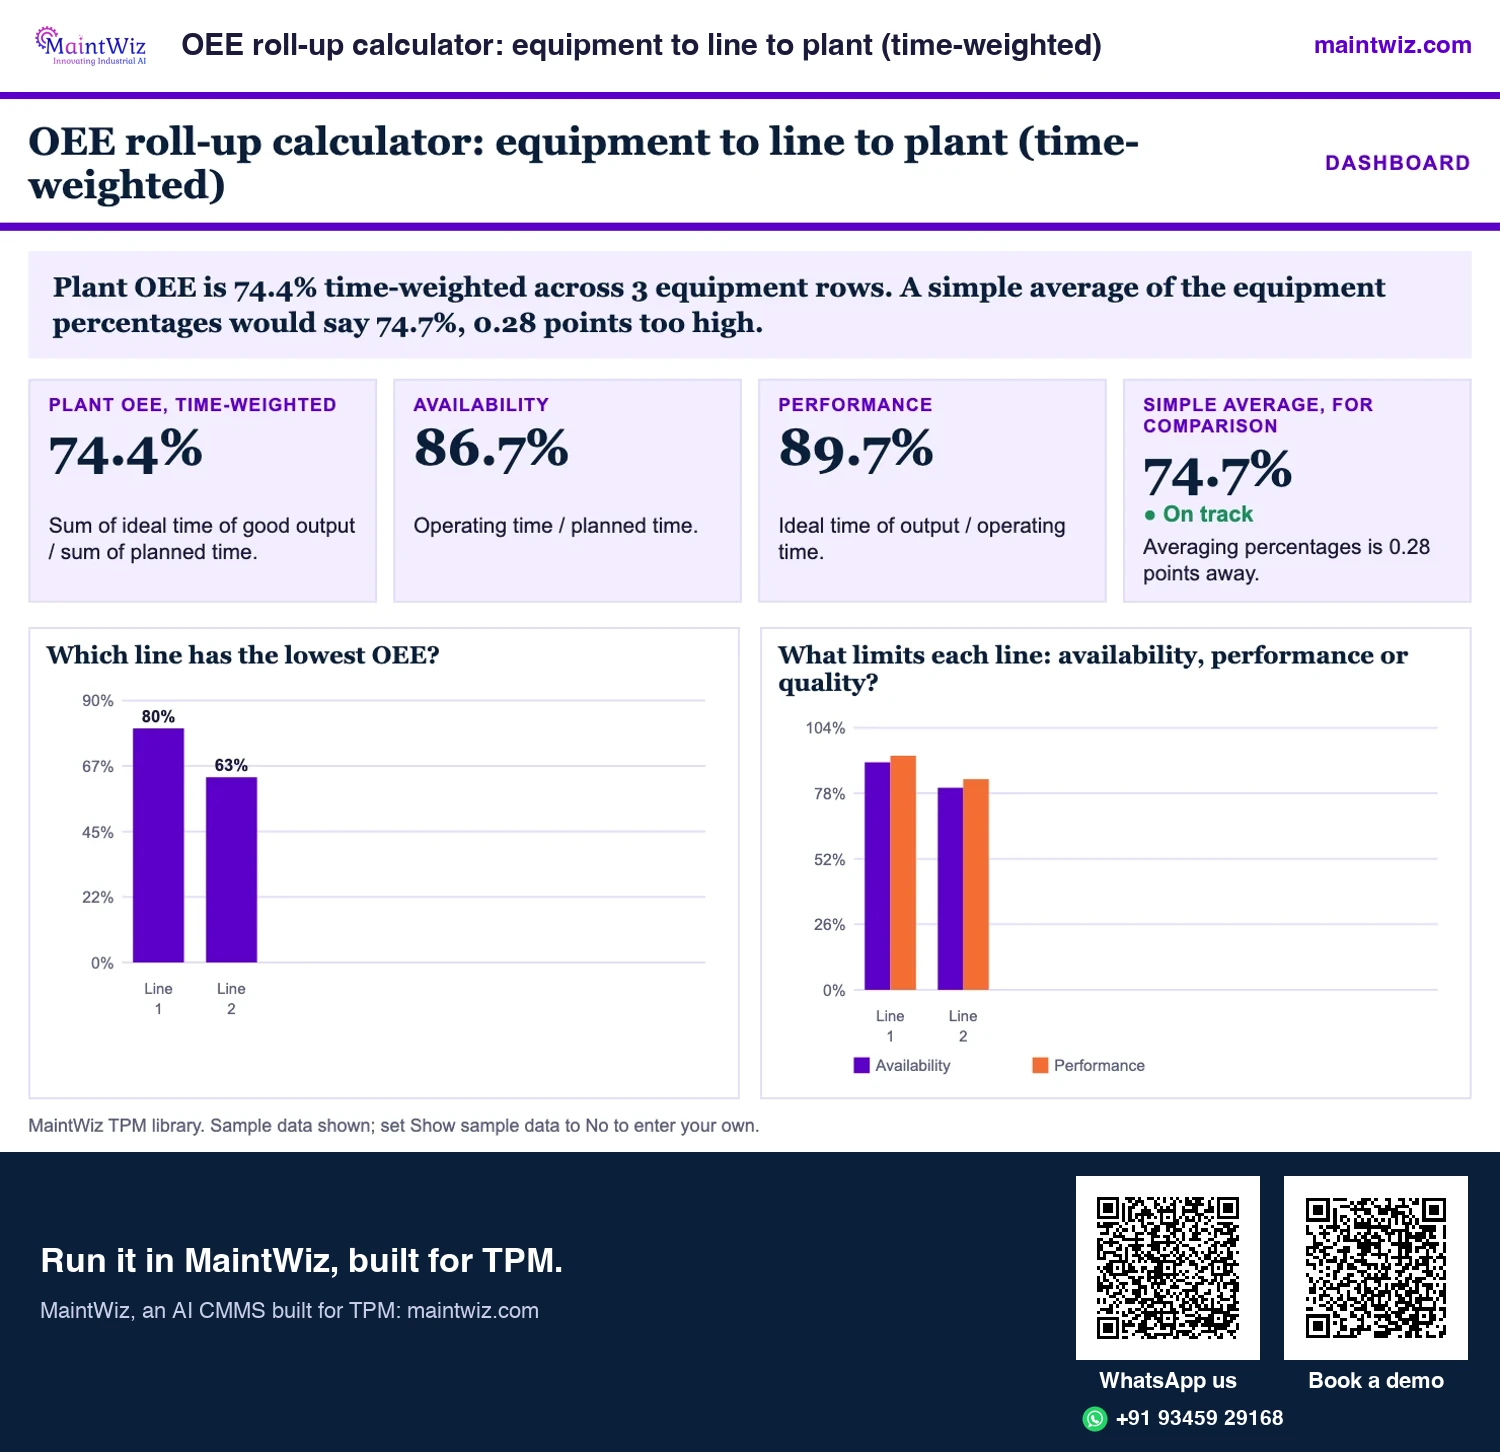
Time cascade
How OEE works: the time cascade from planned time to productive time
Read OEE as a cascade in which each step removes one kind of loss. The figures use the worked example below.
| Step | Minutes | What was removed |
|---|---|---|
| Planned production time | 480 | Nothing yet |
| Operating time | 420 | Stops: breakdown, changeover, waiting (60) |
| Time at ideal rate for all parts made | 378 | Minor stops and reduced speed (42) |
| Fully productive time (good parts only) | 360 | Rejects and rework (18) |
OEE = 360 / 480 = 75.0%. Reading the same cascade from 1,440 calendar minutes gives TEEP: 360 / 1,440 = 25.0%.
Calculation
How do you calculate OEE?
- Availability = operating time / planned production time
- Performance = (ideal cycle time x total count) / operating time
- Quality = good count / total count
- OEE = availability x performance x quality
A worked calculation
Take a 480-minute shift with 60 minutes of stops, an ideal cycle time of 0.5 minute per part, 756 parts made and 720 good (Figure 1).
| Factor | Calculation | Result |
|---|---|---|
| Availability | 420 / 480 | 87.5% |
| Performance | (0.5 x 756) / 420 = 378 / 420 | 90.0% |
| Quality | 720 / 756 | 95.2% |
| OEE | 0.875 x 0.900 x 0.952 | 75.0% |
Where the 480 planned minutes go
Availability × performance × quality = 87.5% × 90.0% × 95.2% = 75.0%
ILLUSTRATION
− Stops: 60 min
− Minor stops and reduced speed: 42 min
− Rejects: 18 min
OEE75.0%
- Availability87.5%
- Performance90.0%
- Quality95.2%
 maintwiz.comAI CMMS built for TPM
 WhatsApp us
 +91 93459 29168
 Book a demo
Equivalent shortcut: ideal time of the good parts / planned time = (0.5 x 720) / 480 = 75.0%. To calculate OEE in six steps: fix the period and definitions, take planned time, subtract stops, compare ideal output with operating time, take good over total count, multiply and check with the shortcut.
Three factors
The three factors in detail
Availability
Availability depends on two decisions: what counts as planned time (breaks and scheduled non-production are normally excluded) and what counts as a stop. Settle the shortest stop logged as downtime (shorter events show as minor stops in performance) and how a stop crossing a shift change is split.
Performance
Performance captures minor stops too short to log and running below the ideal speed. The ideal cycle time is the design rate or the best rate demonstrated for that product; an average rate hides speed loss and can push performance above 100%.
Quality
Quality counts parts good first time: reworked parts are not good in the OEE sense, and start-up rejects count.
Ideal cycle time
How to find the ideal cycle time
- Start from the design or nameplate rate for the product on that equipment.
- Check it against the best rate demonstrated over a sustained run with good output.
- Record it per product and equipment, with an owner and a date, and review it when tooling or the product changes.
- Never use last month's average rate. If performance exceeds 100%, suspect the ideal cycle time first, then the counts, then over-reported stops.
Planned downtime
Does OEE include planned downtime?
In the usual definition, no: breaks, scheduled maintenance, meetings and no-demand time are taken out of planned production time. TEEP keeps them. Changeovers are the contested case; many plants count them as stops because they are a loss to reduce. Moving items in or out of planned time changes OEE without changing the equipment, so fix the rule and the minimum stop length that counts as downtime, and keep them between periods.
Second example
A second worked example: one machine, two products, and a rate-based case
With mixed products use each product's own ideal cycle time. In a 480-minute shift with 60 minutes of stops (420 operating), product A (0.5 minute ideal) made 400 parts, 392 good; product B (1.0 minute ideal) made 200, 190 good.
| Factor | Calculation | Result |
|---|---|---|
| Availability | 420 / 480 | 87.5% |
| Performance | (0.5 x 400 + 1.0 x 200) / 420 = 400 / 420 | 95.2% |
| Quality (time-weighted) | (0.5 x 392 + 1.0 x 190) / 400 = 386 / 400 | 96.5% |
| OEE | 386 / 480 | 80.4% |
Averaging the cycle times to 0.75 minute would give 450 minutes of ideal output in 420 operating minutes, a performance of 107%: a figure above 100% signals a wrong input.
Rate-based lines
When the ideal speed is a rate-based figure in units per minute, use it in place of cycle time. With 480 planned minutes, 48 of stops, an ideal rate of 20 a minute, 7,800 parts made and 7,644 good: availability 90.0%, performance 7,800 / 8,640 = 90.3%, quality 98.0%, OEE 79.6%.
Run these cases on your own shifts in the free OEE calculator workbook, which weights mixed products by ideal time.
Practice
Practice problems
| Problem | Answer |
|---|---|
| Planned 420 min, stops 42, ideal cycle 1.2 min, 300 parts, 285 good. OEE? | Operating 378; A = 90.0%; P = 360 / 378 = 95.2%; Q = 95.0%; OEE = 81.4%. |
| OEE 82%, availability 90%, quality 98%. Performance? | 0.82 / (0.90 x 0.98) = 93.0%. |
| Availability 90%, performance 90%, quality 95%. Is this the 85% 'world class'? | 0.90 x 0.90 x 0.95 = 77.0%: three good-looking factors multiply to well below 85%. |
Data needed
What data do you need to measure OEE?
| Data | Source | Check before you trust it |
|---|---|---|
| Planned production time | Shift calendar, minus planned stops in your definition | Same rule on every shift |
| Stops and reason codes | Operator entries or machine signals | Few, distinct codes that are used |
| Total and good counts | Counters, quality records | Rework treated the same in every report |
| Ideal cycle time | Design or best demonstrated rate per product | Not an average |
Plants often combine machine counts and stop times with operator reason codes. Validate any automatic signal against a manual count.
Six big losses
What are the six big losses behind OEE?
TPM groups the losses behind each factor: breakdowns and setup and adjustment reduce availability; idling and minor stops and reduced speed reduce performance; process defects and rework and reduced yield at start-up reduce quality. Work the largest of the six big losses first, using a Pareto of lost time (Figure 3).
The six big losses and the OEE factor they reduce
Two losses behind each of the three OEE factors
- A
Availability loss
- Equipment breakdowns
- Setup and adjustment
- P
Performance loss
- Idling and minor stops
- Reduced speed
- Q
Quality loss
- Process defects and rework
- Reduced yield at start-up
Six big losses as set out by Seiichi Nakajima (JIPM)
maintwiz.comAI CMMS built for TPMWhatsApp us+91 93459 29168Book a demoRoll-up
Rolling OEE up from equipment to line and plant
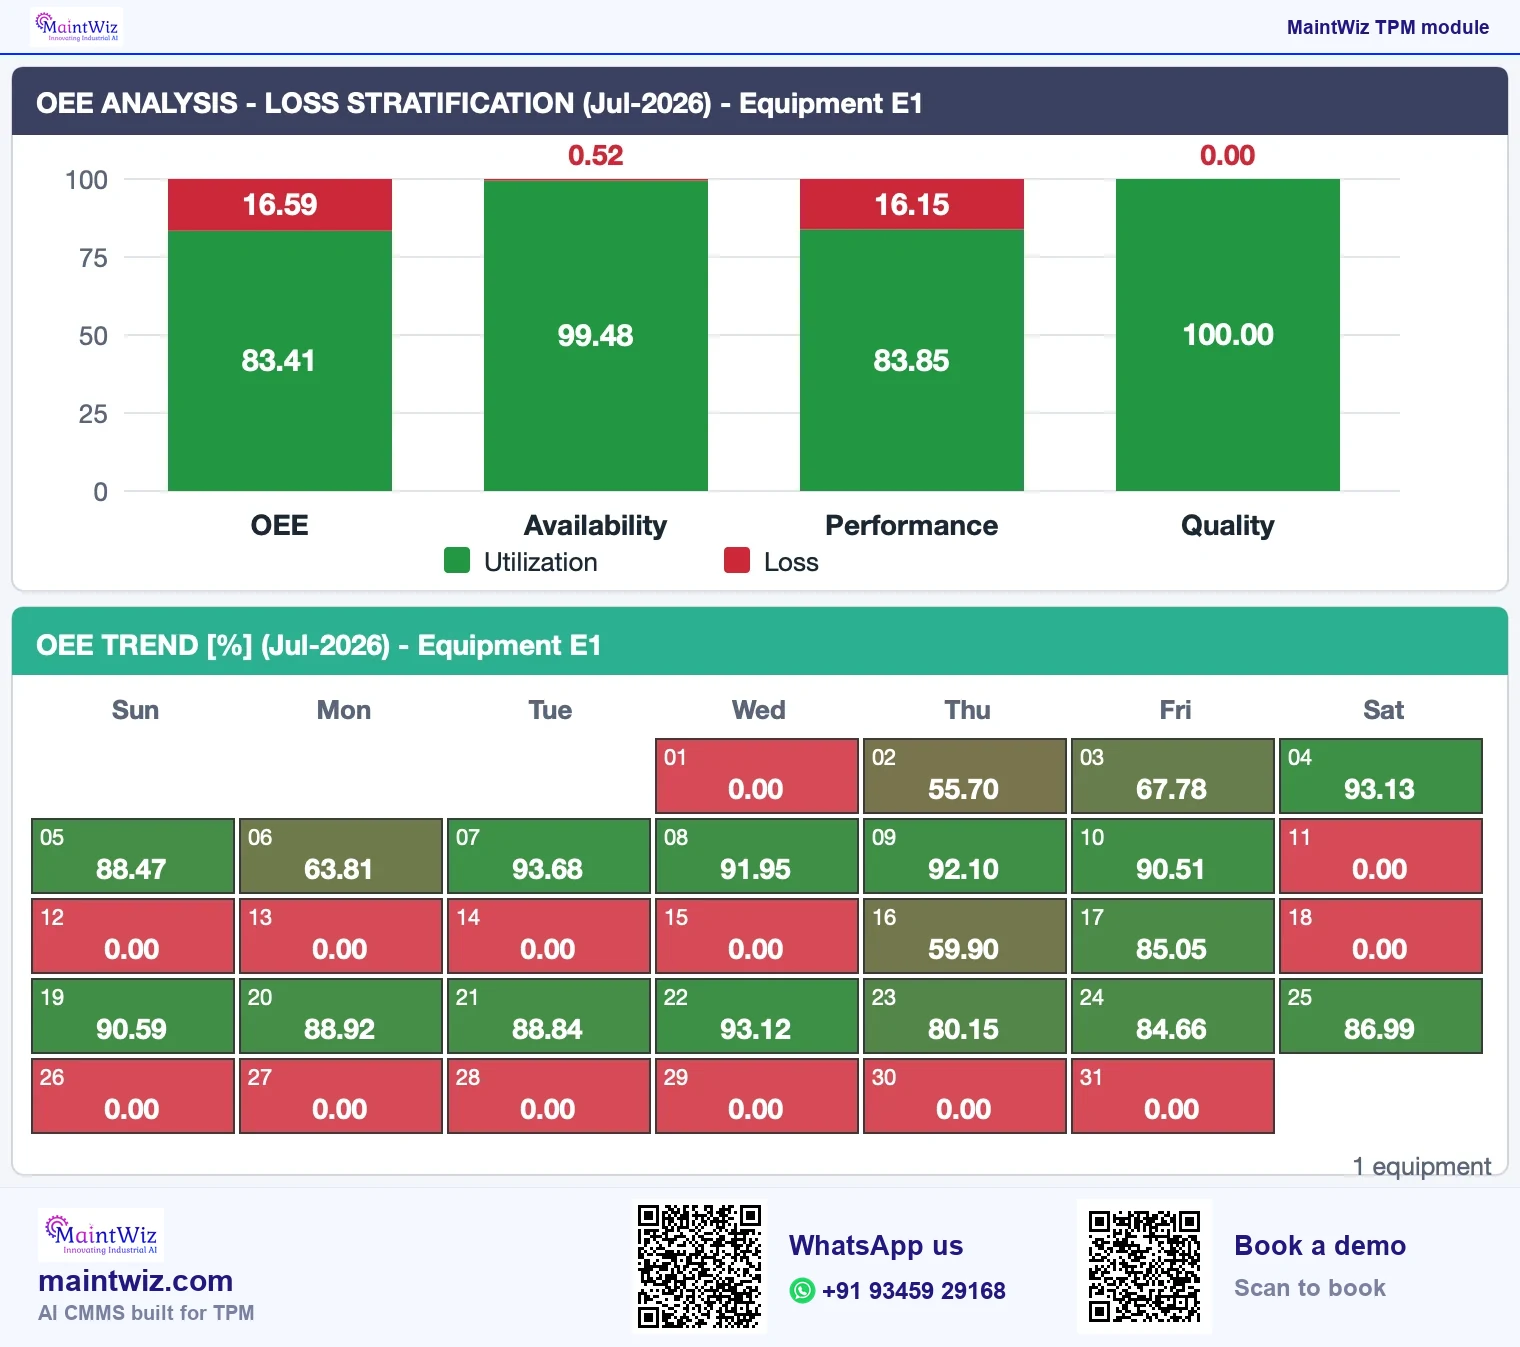
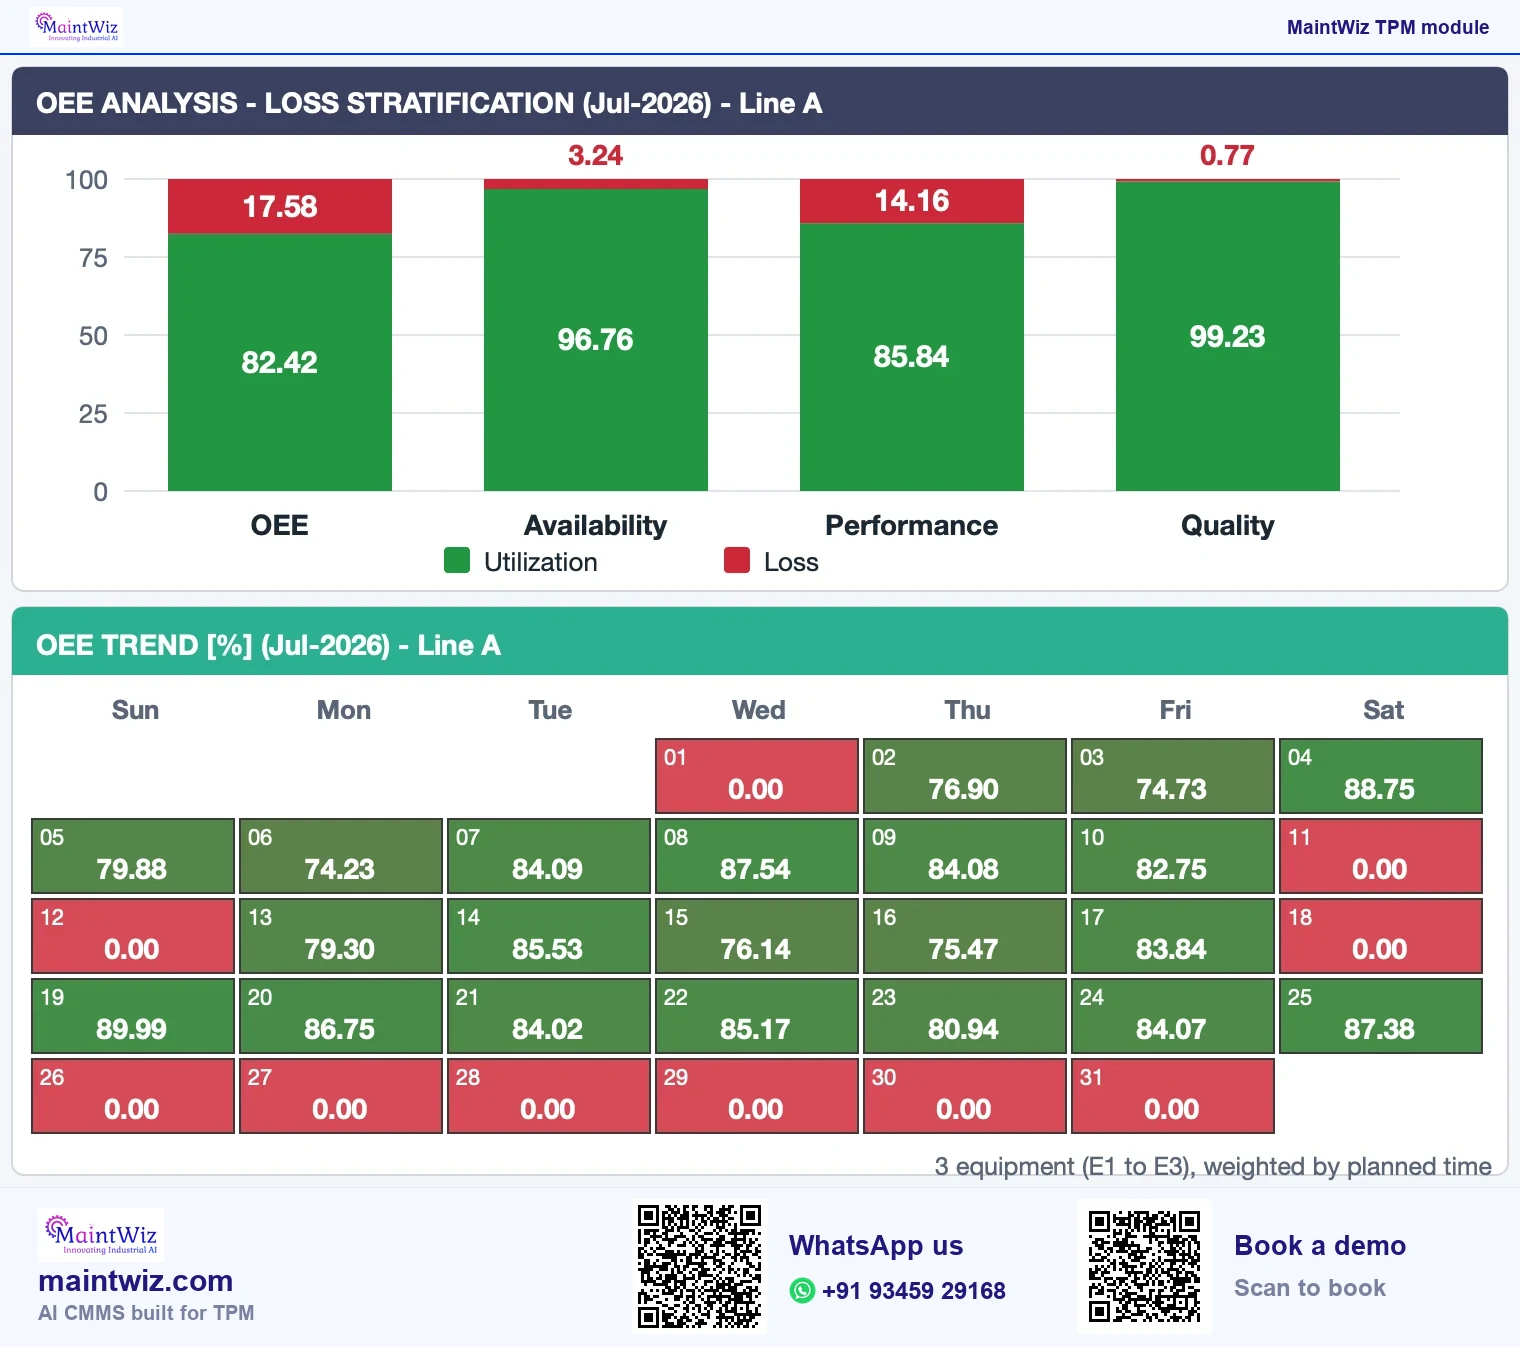
Add the underlying times first and divide once; averaging OEE percentages gives a 300-hour machine the same weight as a 600-hour one. Two equipment on a line have planned times of 600 h and 300 h and ideal time of good output of 475 h and 245 h, so OEE of 79.2% and 81.7%. The line OEE is (475 + 245) / (600 + 300) = 80.0%; the simple average of the percentages gives 80.4%. The same rule applies from line to plant (Figure 4).
On a line of interlinked machines the slowest or the one that stops the others sets the real output, so decide whether line OEE comes from the line's end-of-line count or from rolled-up machines, and do not mix them. Compare plants only on the same definitions, product mix and planned-time rules; otherwise compare each plant with its own history. See the OEE measurement guide.
| Equipment or level | Line | Planned production time (h) | Ideal time of good output (h) | OEE |
|---|---|---|---|---|
| E1 (the equipment shown above) | Line A | 360.0 | 300.29 | 83.41% |
| E2 | Line A | 418.0 | 350.69 | 83.90% |
| E3 | Line A | 304.0 | 240.80 | 79.21% |
| E4 | Line B | 528.0 | 443.47 | 83.99% |
| E5 | Line B | 460.0 | 351.20 | 76.35% |
| E6 | Line C | 450.0 | 364.49 | 81.00% |
| Line A (E1 to E3) | - | 1,082.0 | 891.78 | 82.42% |
| Line B (E4, E5) | - | 988.0 | 794.67 | 80.43% |
| Line C (E6) | - | 450.0 | 364.49 | 81.00% |
| Plant A (E1 to E6) | - | 2,520.0 | 2,050.94 | 81.39% |
The line and plant views are built from the equipment in the table, not from the two-equipment example above. Line A is equipment E1 to E3: (300.29 + 350.69 + 240.80) / (360.0 + 418.0 + 304.0) = 891.78 / 1,082.0 = 82.42%. A simple average of the three equipment OEEs would give 82.17%, which is not the line's OEE, because the equipment ran for different planned times. The plant is the same calculation over all six equipment: 2,050.94 / 2,520.0 = 81.39%, against 81.31% for a simple average. Equipment E1 is the equipment shown in the equipment view (July 2026, OEE 83.41%); E2 to E6 complete the three lines. Line and plant OEE roll up from equipment by planned time, and the line and plant views can be configured to show the equipment in scope.
OEE, TEEP, OOE
What is the difference between OEE, TEEP and OOE?
TEEP = OEE x loading (TEEP is total effective equipment performance), where loading is planned production time divided by all calendar time. In the example, 480 planned minutes in a 1,440-minute day is a loading of 33.3%, so TEEP is 75.0% x 33.3% = 25.0%. OOE (overall operations effectiveness) measures against the full calendar and sits beside TEEP; define it before comparing. ISO 22400-2:2014 defines manufacturing KPIs and BSI PAS 1918:2022 sets out TPM KPIs. Adopt one definition and write it down (Figure 5).
OEE measures planned time; TEEP measures all calendar time
Calendar time: 24 h = 1,440 min
Planned production time:
480 min (one shift)
Not scheduled: 960 min
Fully productive time: 360 min
OEE basis
TEEP basis
OEE = Availability × Performance × Quality = 87.5% × 90.0% × 95.2% = 75.0%
Loading = 480 / 1,440 = 33.3%
TEEP = OEE × loading = 75.0% × 33.3% = 25.0%
maintwiz.comAI CMMS built for TPMWhatsApp us+91 93459 29168Book a demoOther measures
OEE compared with utilisation, productivity, yield and other measures
| Measure | How it differs from OEE |
|---|---|
| Equipment or capacity utilisation | Share of time running (or output against maximum); ignores speed and quality |
| Productivity and throughput | Output per unit of input or per unit time; throughput says nothing of quality or planned time |
| Yield | Good output against input material; close to the quality factor but about material, not time |
| Uptime | Roughly availability, often not against planned time |
| OLE, OPE, TRS | Overall labour and plant effectiveness; TRS is the French-language term for OEE |
By role
OEE for operators, maintenance and managers
| Role | How they use OEE |
|---|---|
| Operator | Records stops and counts honestly; sees the loss list each shift |
| Maintenance | Reads availability losses for breakdown patterns; links them to the PM plan and operator tags |
| Plant manager | Reads trends by line and plant on one definition; asks which loss is being worked |
Why measure OEE? It puts availability, speed and quality on one scale, ranks what to fix and gives teams a common language.
By machine type
OEE by machine type, industry and process type
| Equipment | Points to settle in the definition |
|---|---|
| CNC machine | Cycle time per part and programme; tool changes; first-off approval as setup or quality loss |
| Injection moulding | Cycle time per shot and cavities; purging and start-up scrap |
| Assembly line | Line speed; which station sets the pace; interlinked equipment as one line or separately |
| Packaging line | Rate in units a minute; micro-stops; format changeover; damaged packs |
| Batch process | Batch time against planned time; cleaning between batches; yield as the quality factor |
OEE is used in discrete manufacturing, process industries such as food and beverage and pharmaceutical, packaging and mining. For discrete, batch and continuous processes the three factors hold but the inputs differ: counts and cycle time, batch time and yield, or rate against ideal throughput.
Good score
What is a good OEE score?
85% is the figure quoted as world-class OEE: 90% availability x 95% performance x 99% quality (84.6%), framed for high-volume discrete lines with little changeover. Set your target from your own baseline and raise it as each loss is removed.
Where the 85% figure comes from
Three factors multiply; they do not average
Nakajima benchmark
90% × 95% × 99%
= 84.6%
Availability × performance × quality, for high-volume discrete lines
Three good-looking factors
90% × 90% × 95%
= 77.0%
Each factor looks fine on its own; the product is far lower
Compare with your own baseline on one definition
maintwiz.comAI CMMS built for TPMWhatsApp us+91 93459 29168Book a demoSee OEE on your own line: book a demo and bring one month of stops and counts. MaintWiz, an AI CMMS built for TPM, shows OEE by equipment, line and plant with loss stratification.
OEE benchmark by your own history
Industry benchmarks use different definitions and equipment mixes, so your own trend on a fixed definition is the comparison that counts. To set an OEE target, measure a baseline on a fixed definition including short stops, rank the losses, estimate what removing the largest is worth (the what-if calculator shows the arithmetic), and review the target each quarter. 100% OEE is a theoretical ceiling, and a reading near it usually points to a wrong ideal rate or missing stop records.
Mistakes
Common OEE mistakes and what to read beside it
- Cost: a point of OEE on a bottleneck is worth more than on a non-bottleneck.
- Time outside planned production: that is what TEEP adds.
- Definitions: two plants with the same OEE may differ; averaging speeds, counting rework as good, or moving planned stops out of the base can be gamed or accidental.
- What to fix: the loss breakdown does that, not the headline.
- Other TPM measures sit beside it: MTBF, MTTR and PM compliance explain availability losses, and an OEE KPI tree links factors to loss categories to causes an owner can act on.
Real-time and reports
Real-time OEE and what an OEE report should show
Real-time OEE needs machine states and counts as they happen, a reliable ideal rate, a prompt for the stop reason and a display people on the floor read. It shortens the time between a loss and someone acting on it.
What an OEE report should show
An OEE report should show:
- OEE with availability, performance and quality side by side.
- A loss Pareto in time, and a trend on the same definition.
- A time-weighted roll-up to line and plant.
- The top stop reasons, the project on each, and the definitions in force.
Review each shift (operators and supervisor), weekly by line, monthly by plant and quarterly by group.
Tracking OEE every shift is the job of OEE software: what OEE software is comes down to four inputs, one calculation and a ranked loss list that tells the team what to fix first. MaintWiz, an AI CMMS built for TPM, shows OEE per equipment with loss stratification, a daily trend and a lost-hours Pareto, rolls it up to line and plant by planned time, and takes counts and stops from IoT, MES, SCADA, PLC or DCS sources or from operator entry. See the OEE software or book a demo and bring one line's last month of stops.
Improving OEE
How can you improve OEE?
Reduce the largest loss first, one at a time, and check each fix held. Correct data before reporting any factor above 100%. How to improve OEE with TPM sets out a loss-by-loss method.
FAQ
Frequently asked questions
How do you calculate OEE?
Divide operating time by planned production time (availability), ideal output time by operating time (performance) and good count by total count (quality), then multiply the three. Equivalent: ideal time of the good parts divided by planned production time.
What is a good OEE score?
85% is the figure quoted as world-class OEE: 90% availability x 95% performance x 99% quality (84.6%), framed for high-volume discrete lines with little changeover. Set your target from your own baseline on a fixed definition and raise it as each loss is removed.
What is the difference between OEE and TEEP?
TEEP, total effective equipment performance, uses all calendar time as the base instead of planned production time, so it also reflects capacity that was never scheduled. OEE looks at how well scheduled time was used.
Why is my OEE above 100 percent?
Performance or quality above 100 percent means a data error, usually an ideal cycle time set too slow or counts that do not match. Correct the ideal rate and the counters before reporting the figure.
How is OEE rolled up from equipment to line and plant?
Add the planned production time and the ideal time of good output across the equipment in scope, then divide the second by the first. Do not average the percentages, which gives small and large equipment the same weight.
What is the ideal cycle time in OEE?
It is the design rate, or the best rate demonstrated, for a product on a given equipment, expressed as time per part. It is not an average. If it is set too slow, performance rises artificially and can exceed 100%.
Does OEE include planned downtime?
In the usual definition, no: planned non-production such as breaks and scheduled maintenance is removed from planned production time, so it does not reduce OEE. TEEP keeps it. Changeovers are the contested case, so write down whether yours count as stops.
How do you calculate OEE for multiple products?
Use the ideal cycle time of each product. Add the ideal time of all parts made (performance) and of the good parts (quality), then divide the ideal time of good parts by planned production time. Averaging cycle times can push performance above 100%.
How do you set an OEE target?
Measure a baseline on a fixed definition, rank the losses, estimate what removing the largest ones is worth, and set a target against your own history and planned projects, not against another plant. Review it when product mix or equipment changes.
Sources
Sources
- JIPM, About TPM https://www.jipmglobal.com/about/tpm/
- BSI PAS 1918:2022, Total Productive Maintenance: implementing key performance indicators, guide. https://knowledge.bsigroup.com/products/total-productive-maintenance-tpm-implementing-key-performance-indicators-guide
- Ahuja, I.P.S. and Khamba, J.S. (2008). Total Productive Maintenance: literature review and directions. International Journal of Quality & Reliability Management 25(7), 709-756. https://www.emerald.com/ijqrm/article/25/7/709/149131/Total-productive-maintenance-literature-review-and
- ISO 22400-2:2014, Automation systems and integration: Key performance indicators (KPIs) for manufacturing operations management, Part 2: Definitions and descriptions https://www.iso.org/standard/54497.html