
Key takeaways
- OEE = availability x performance x quality, calculated from planned time, stops, ideal cycle time, total parts and good parts.
- The default inputs reproduce a checked example: 480 minutes, 60 minutes of stops, 0.5 minute per part, 756 parts, 720 good gives 75.0%.
- Performance above 100% is a data error: look at the ideal cycle time first.
- For several products or for line and plant roll-ups, use the workbooks: averaging percentages gives the wrong answer.
Calculator
Free OEE calculator
Working shown
Next: get the Excel workbook for daily logs and roll-ups, rank what you lose in the six big losses, or log OEE every shift without a spreadsheet with MaintWiz OEE software (book a demo).
 maintwiz.comAI CMMS built for TPM
 WhatsApp us
 +91 93459 29168
 Book a demo
What is the gap to your target worth?
Enter your target OEE, what one good part contributes and how many shifts you run in a year. The calculator above supplies your OEE.
Stops mean all time lost during planned production time under your definition of downtime. Tick the two-product box to enter a second product with its own ideal cycle time: the calculator then weights by ideal time, as in the second worked example on the OEE page. OEE is the headline measure of TPM, the approach JIPM, the Japan Institute of Plant Maintenance, proposed in 1971.
Track this OEE every shift: MaintWiz logs stops and counts per equipment, rolls OEE up to line and plant by planned time, and the whole TPM rolls out in 6 to 8 weeks with Excel uploads of your masters. Book a demo with one month of your line data.
Write down your own definitions of planned time, stops and rework before comparing figures (Figure 1).
From five inputs to OEE
What the calculator takes and the steps it shows
Planned production time and stops
Operating time = planned minus stops
Availability, performance and quality
OEE = A x P x Q
Check: ideal time of good parts / planned time
Inputs: planned time, stops, ideal cycle time, total parts, good parts
maintwiz.comAI CMMS built for TPMWhatsApp us+91 93459 29168Book a demoDownloads
OEE calculator in Excel: workbook, what-if planner and shift sheet
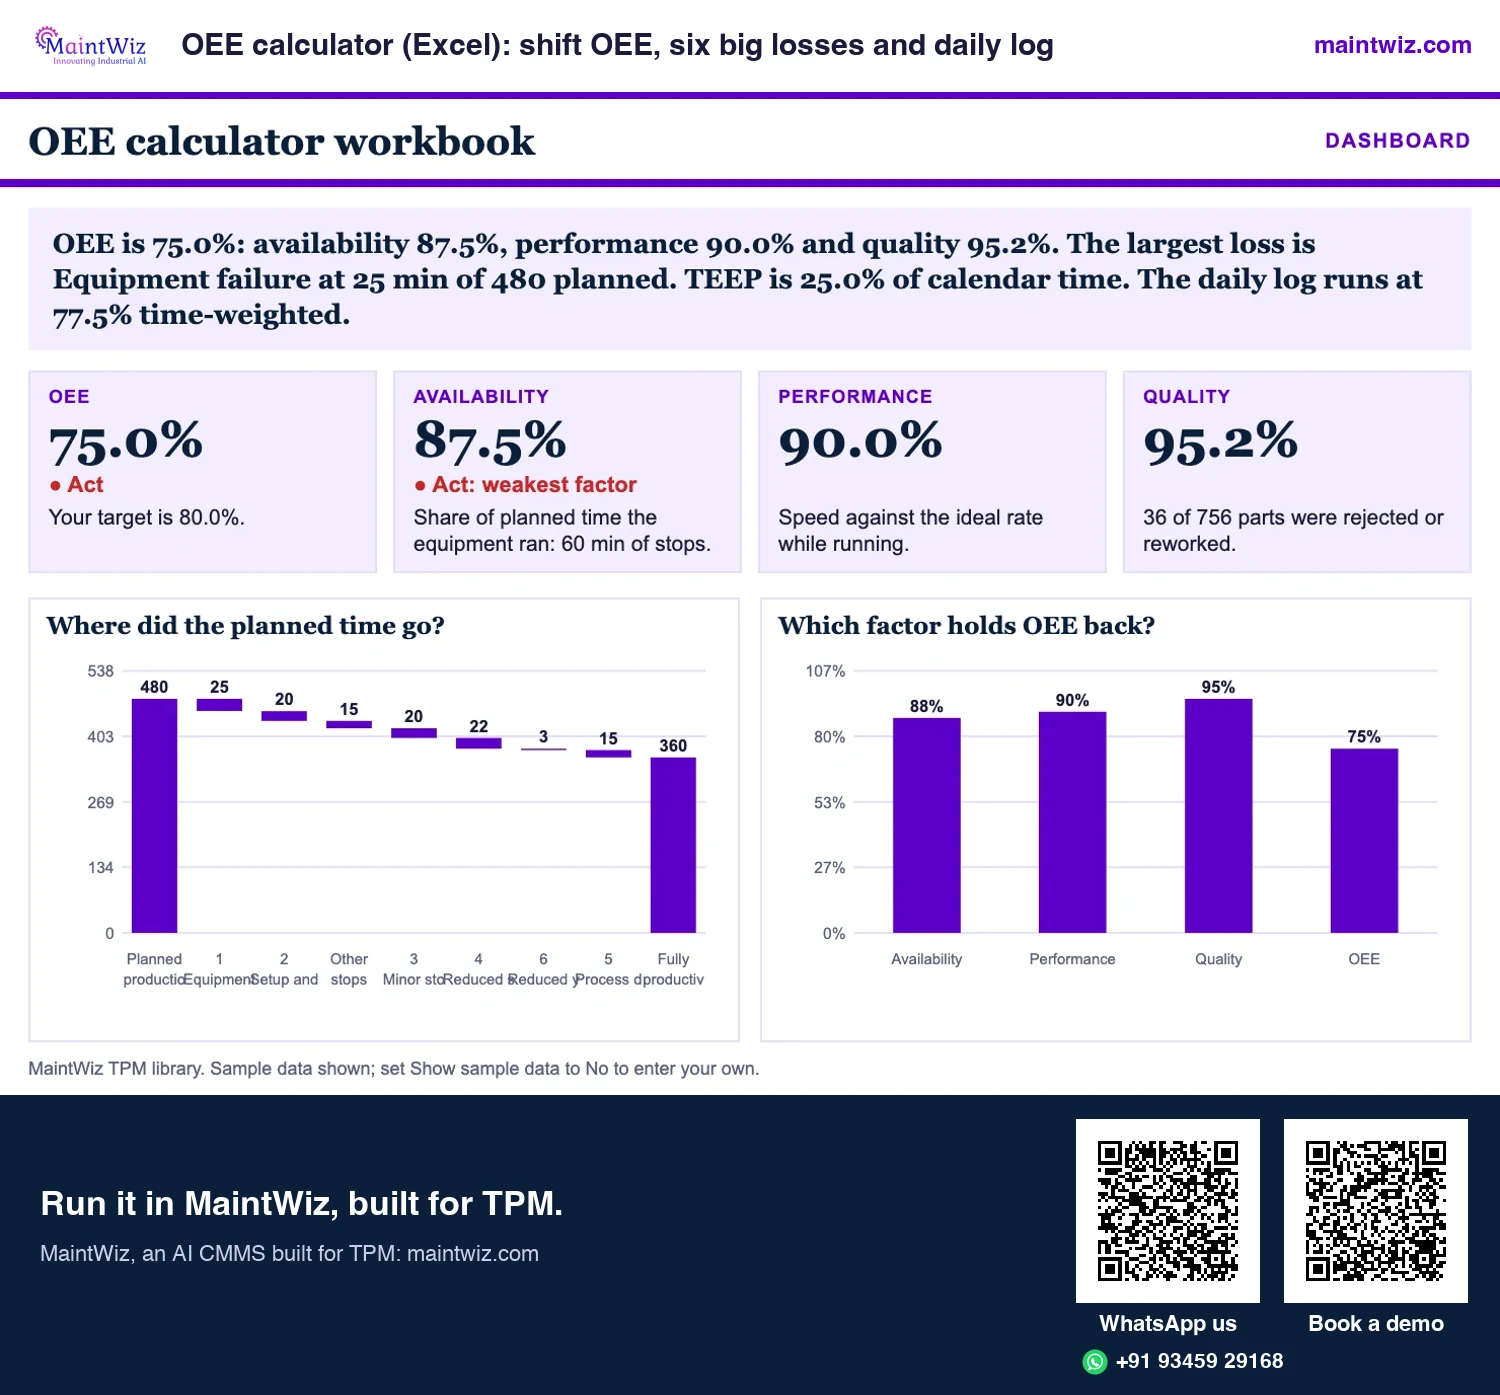
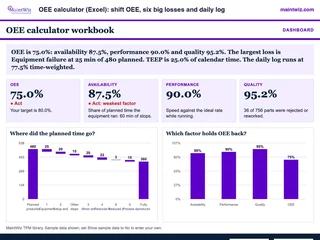 ExcelOEE calculator (Excel): shift OEE, six big losses and daily log
Type one shift and see OEE, the three factors and where every planned minute went
- Sheets
- Dashboard, Shift calculator, Daily log, 480 min shift, Two products in one shift, Read me
- A4
- Version
- v1.1, 5 November 2026
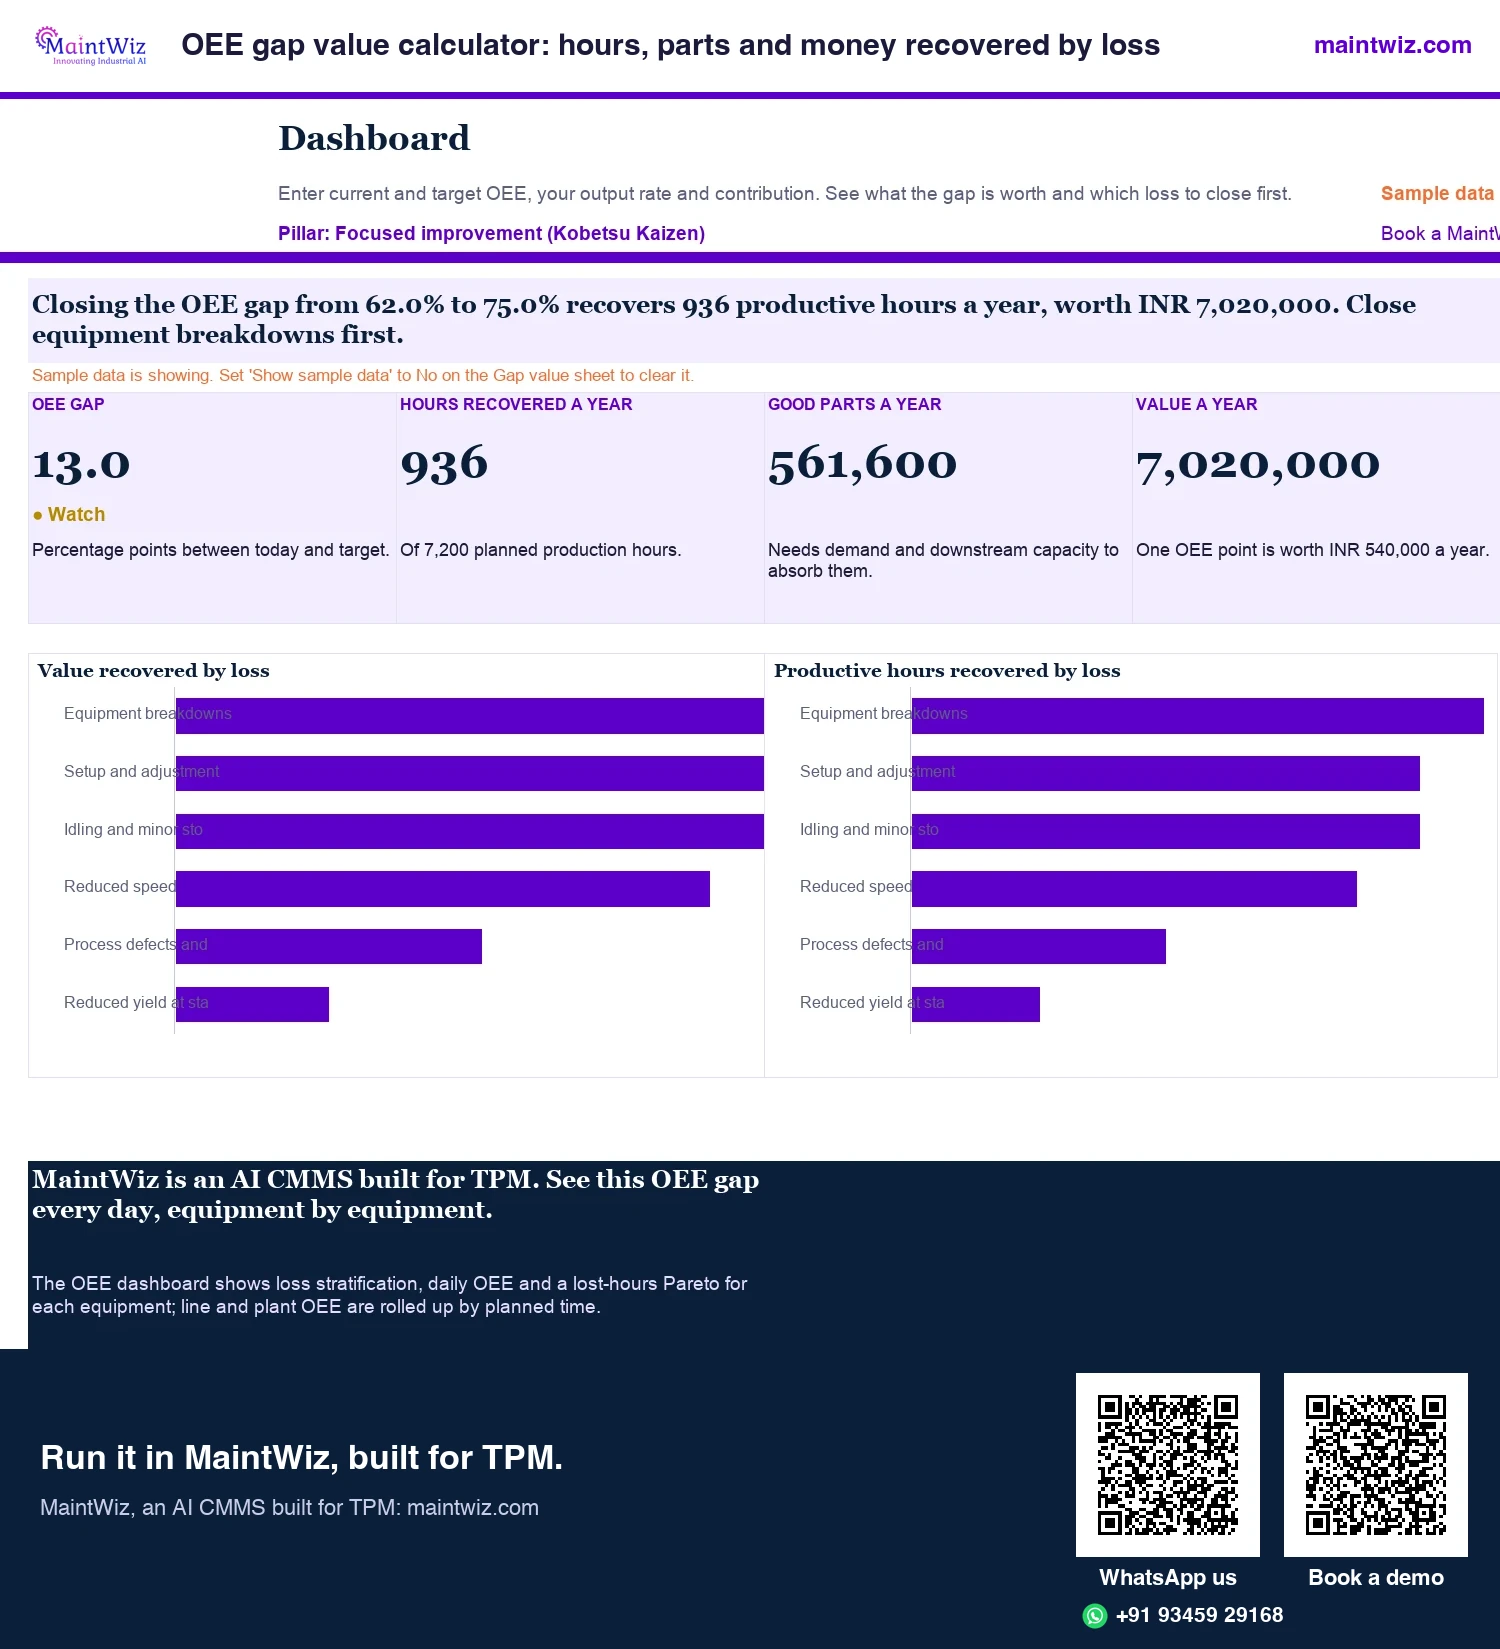
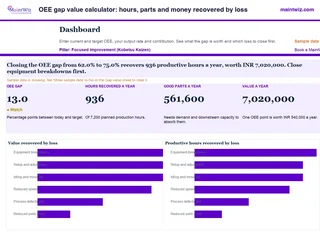 ExcelOEE gap value calculator: hours, parts and money recovered by loss
Turn the gap between current and target OEE into productive hours, good parts and money a year, split across the six big losses.
Inside: Current OEE, target OEE, planned hours and output rate · Contribution per good part, in your currency · Hours recovered, good parts and value a year · Value by loss for the six big losses
- Sheets
- Dashboard, Gap value, Read me
- A4
- Version
- v1.0, 2 November 2026
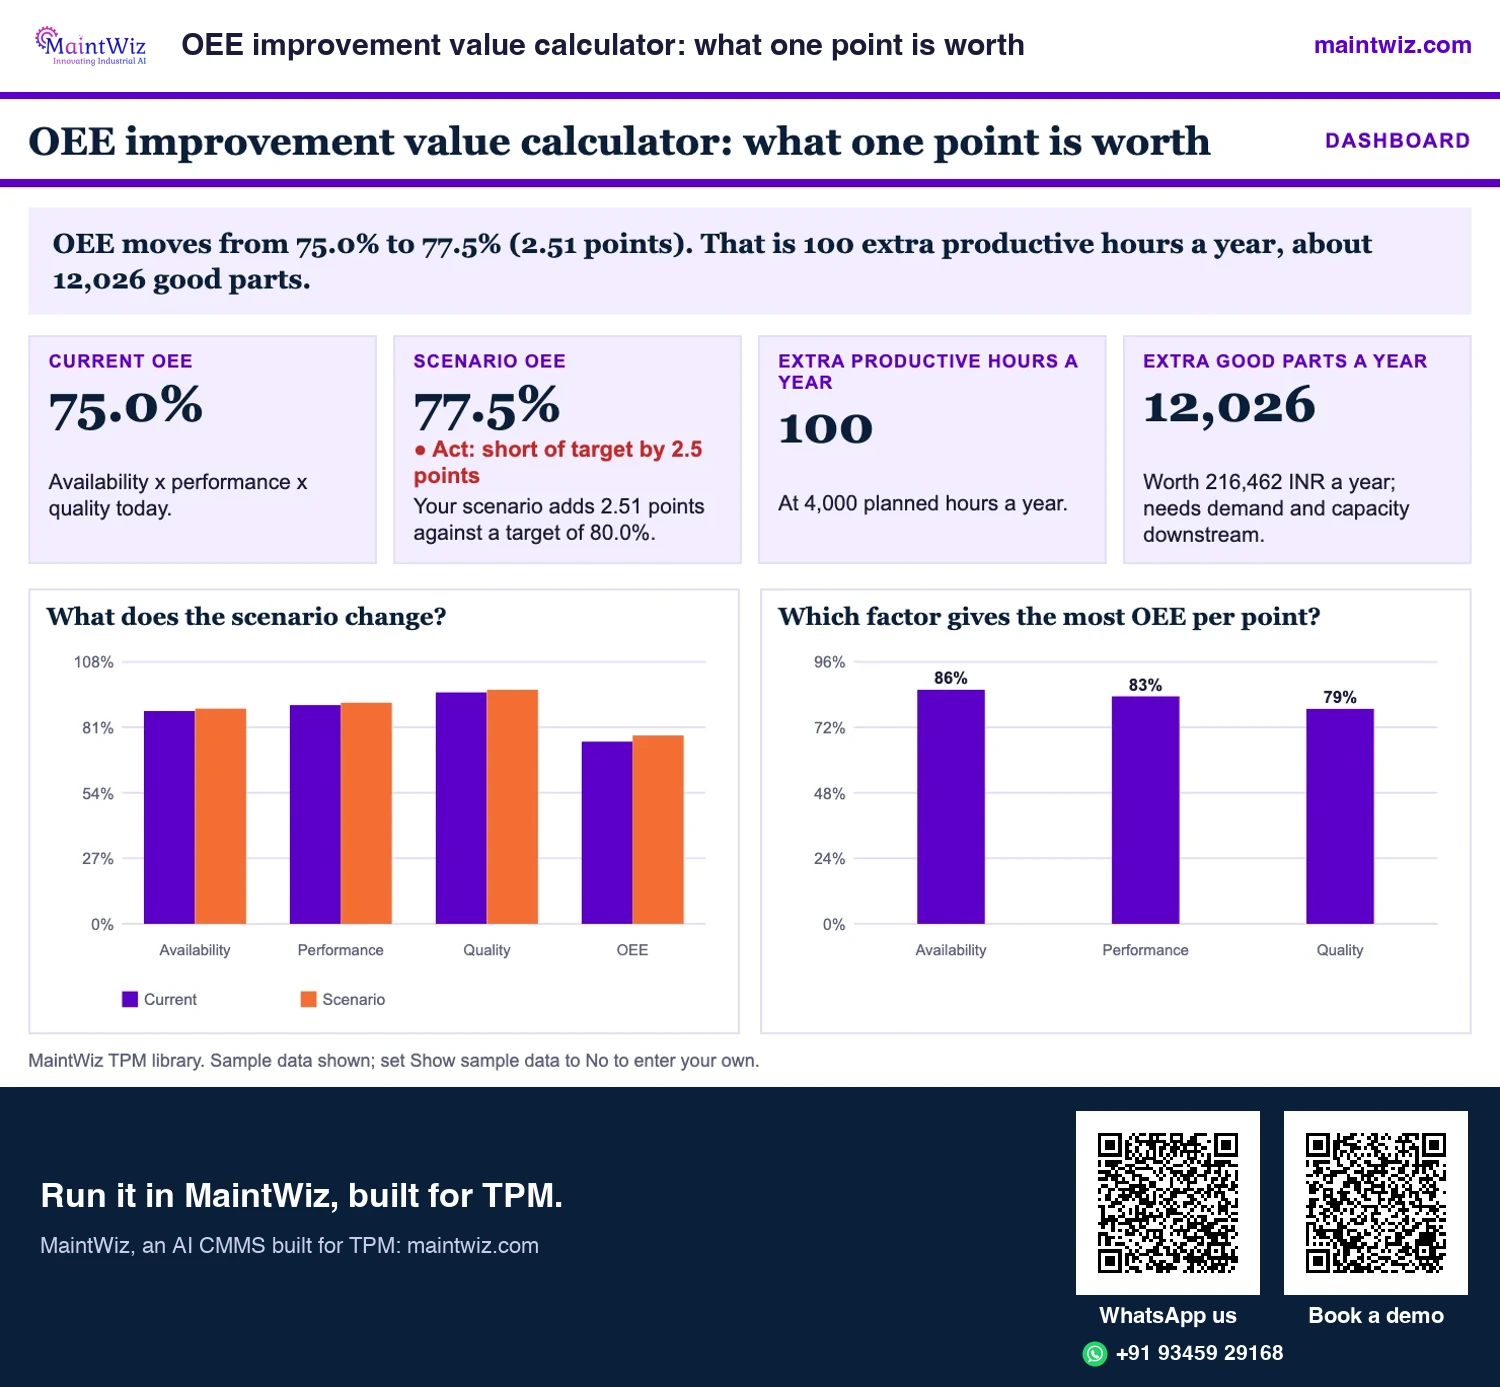
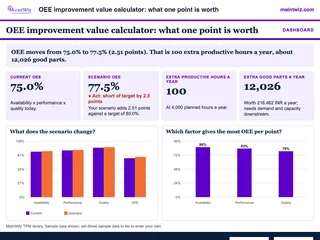 ExcelOEE improvement value calculator: what one point is worth
See what one point of availability, performance or quality is worth in hours and good parts
- Sheets
- Dashboard, What-if, Read me
- A4
- Version
- v1.0, 2 November 2026
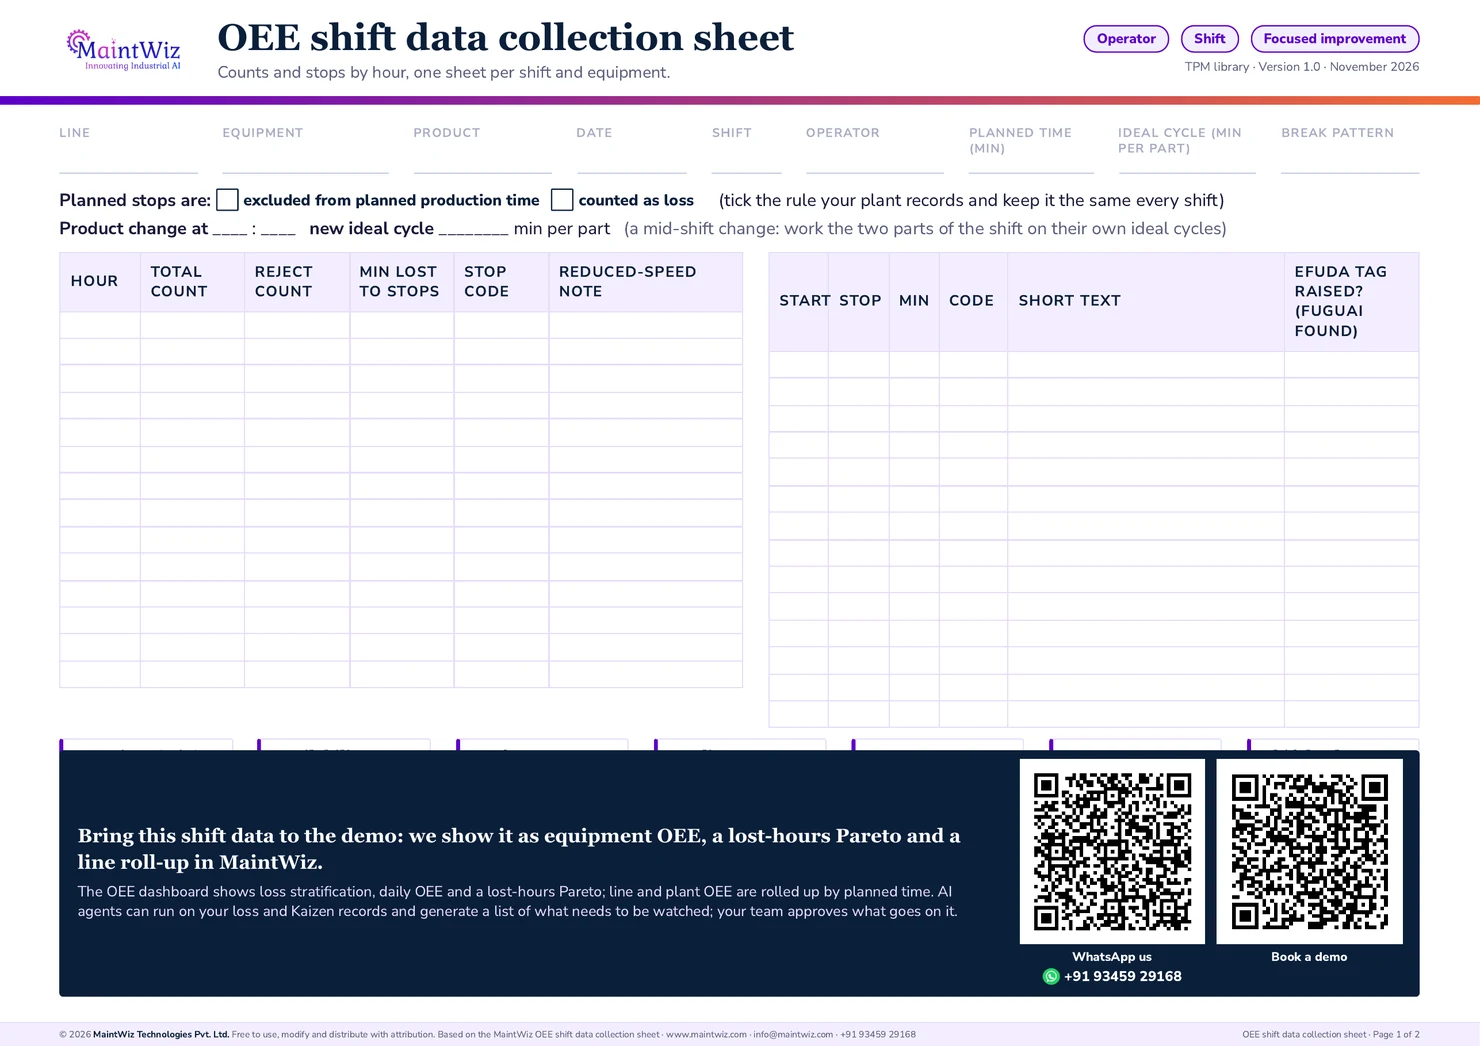
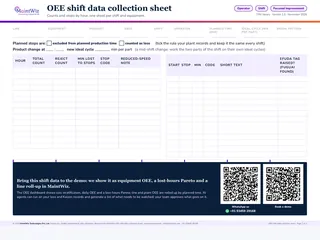 PDFOEE shift data collection sheet
Print one sheet per shift and equipment: hourly counts, a coded stop log, efuda tag column and a product change line
- Pages
- 2
- A4 landscape
- Created
- 5 November 2026
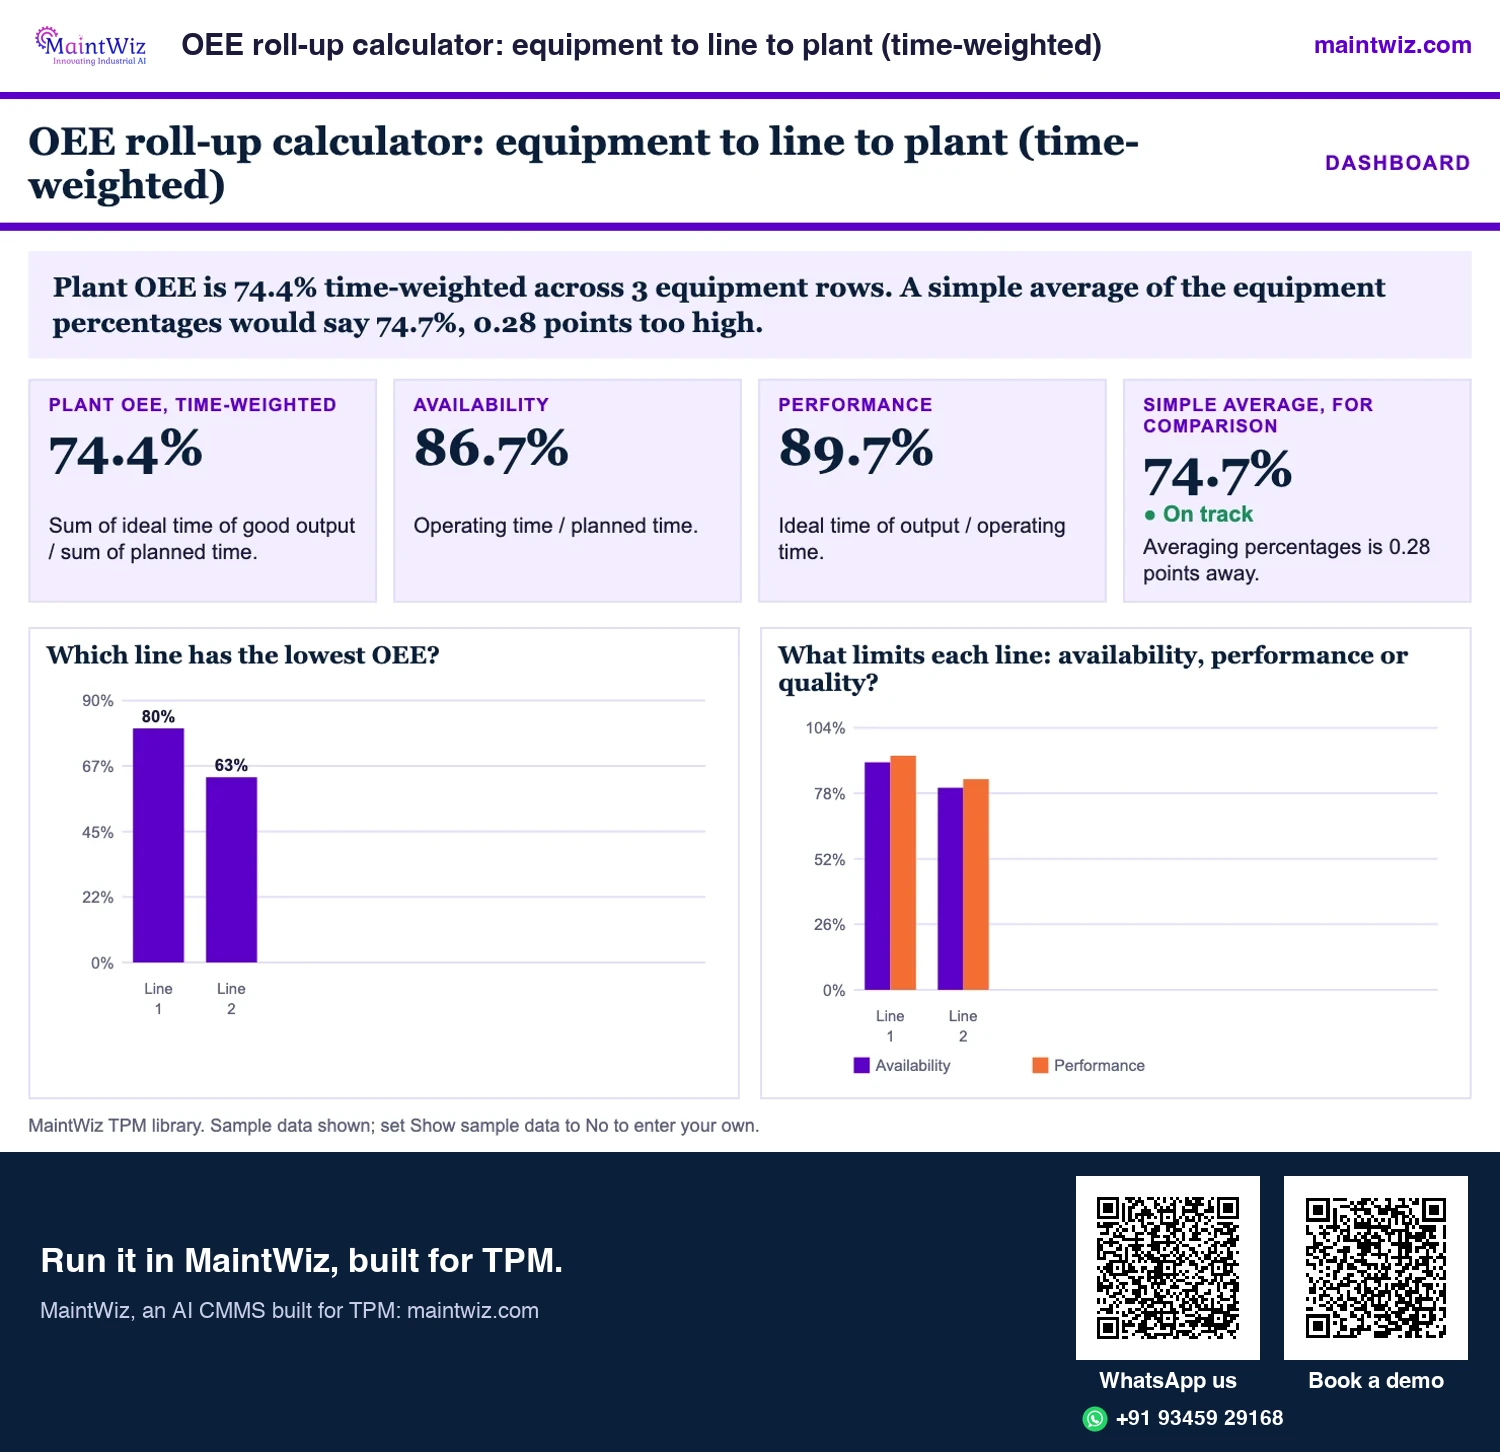
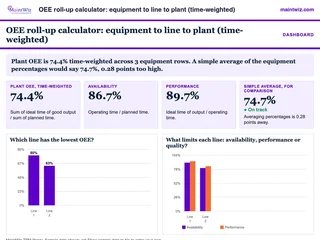 ExcelOEE roll-up calculator: equipment to line to plant (time-weighted)
Roll equipment OEE up to line and plant by planned time
- Sheets
- Dashboard, Inputs, Equipment, Line, Plant, Bottleneck line OEE, Why weighted, Totals, Read me
- A4
- Version
- v1.1, 5 November 2026
Working shown
How are the numbers computed?
- Operating time = planned production time - stops
- Availability = operating time / planned production time
- Performance = (ideal cycle time x total parts) / operating time
- Quality = good parts / total parts
- OEE = availability x performance x quality
The check row computes OEE a second way: ideal time of the good parts divided by planned time. The two agree when the arithmetic is right. Results are rounded to one decimal place for display (Figure 2).
Where the 480 planned minutes go
Availability × performance × quality = 87.5% × 90.0% × 95.2% = 75.0%
ILLUSTRATION
− Stops: 60 min
− Minor stops and reduced speed: 42 min
− Rejects: 18 min
OEE75.0%
- Availability87.5%
- Performance90.0%
- Quality95.2%
maintwiz.comAI CMMS built for TPMWhatsApp us+91 93459 29168Book a demoMethods note
Availability is operating time over planned production time, performance is ideal output time over operating time, quality is good over total count, and OEE is their product, checked by ideal time of good parts over planned time. They agree with the definition on what is OEE, where OEE vs TEEP vs OOE is explained. Results are rounded to one decimal place for display only; nothing you enter is sent anywhere.
Check the calculator against these cases
| Inputs | Expected result |
|---|---|
| 480 min planned, 60 min stops, 0.5 min per part, 756 total, 720 good | A 87.5%, P 90.0%, Q 95.2%, OEE 75.0% |
| 420 min planned, 42 min stops, 1.2 min per part, 300 total, 285 good | A 90.0%, P 95.2%, Q 95.0%, OEE 81.4% |
| 450 min planned, 55 min stops, 8 seconds per part, 2,500 total, 2,420 good | A 87.8%, P 84.4%, Q 96.8%, OEE 71.7% |
| Two-product mode: 480 min planned, 60 min stops; product A 0.5 min, 400 made, 392 good; product B 1.0 min, 200 made, 190 good | A 87.5%, P 95.2%, Q 96.5% (time-weighted), OEE 80.4% |
Work one by hand first to see the method, then compare with the calculator (Figure 3).
Definition used
Which OEE definition does it use?
The usual one: planned production time excludes breaks and scheduled non-production, so planned stops do not reduce OEE. Stops longer than your minimum stop length count as downtime; shorter events show up in performance. TEEP, which measures against all calendar time, is a different measure: TEEP = OEE x loading, where loading is planned production time divided by calendar time. For a 480-minute plan in a 1,440-minute day the loading is 33.3%, so the default 75.0% OEE gives TEEP = 75.0% x 33.3% = 25.0%. See the difference between OEE, TEEP and OOE. For how the number relates to the TPM method, see OEE vs TPM (Figure 4).
Reading results
How to read the result
85% is the widely cited world-class OEE figure: the product of 90% availability, 95% performance and 99% quality, set for high-volume discrete lines with little changeover. Compare the result with your own earlier results on a fixed definition, and look at which factor is lowest: the lowest factor, and the losses behind it, tell you where to work. The six big losses explain what sits behind each factor.
Common input mistakes
- Using an average speed as the ideal cycle time. It hides speed loss and can push performance above 100%.
- Mixing seconds and minutes: use the unit selector.
- Counting reworked parts as good.
- Including planned breaks in planned production time on one shift and not another.
- Entering part counts from a different period from the stop times.
- Entering a two-product mix as one product: tick the two-product box so the calculator weights by ideal time.
Beyond a calculator
From a calculator to continuous measurement
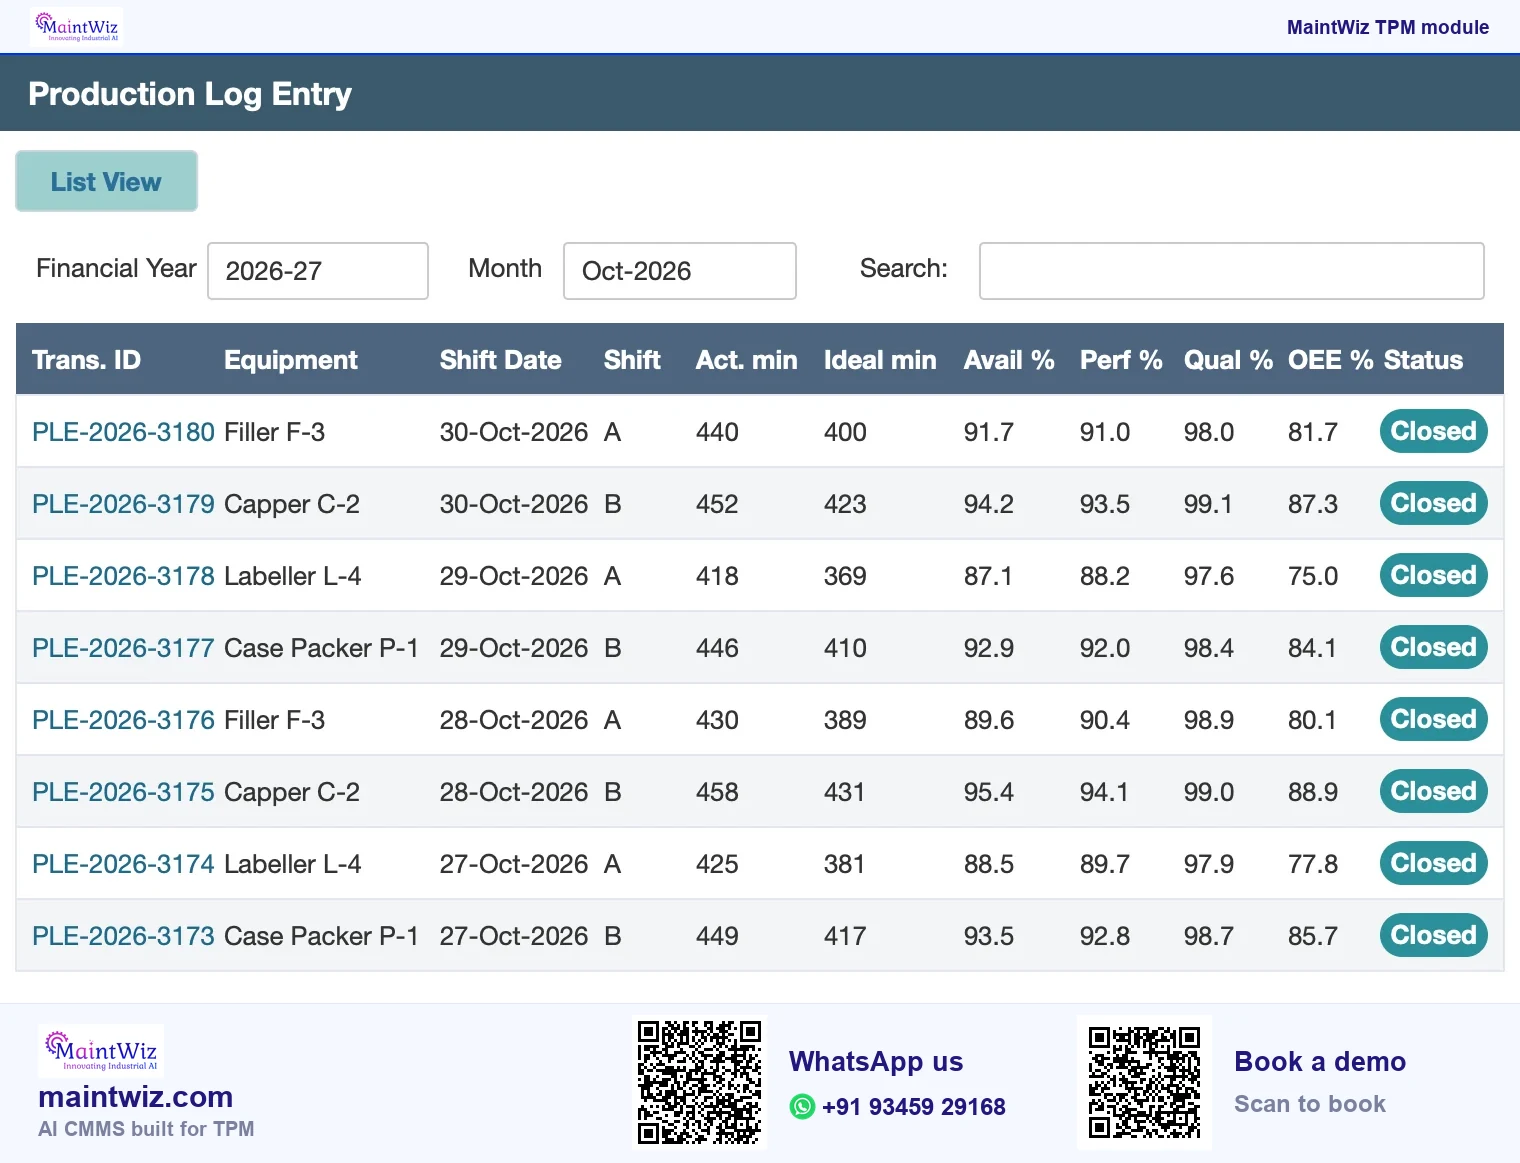
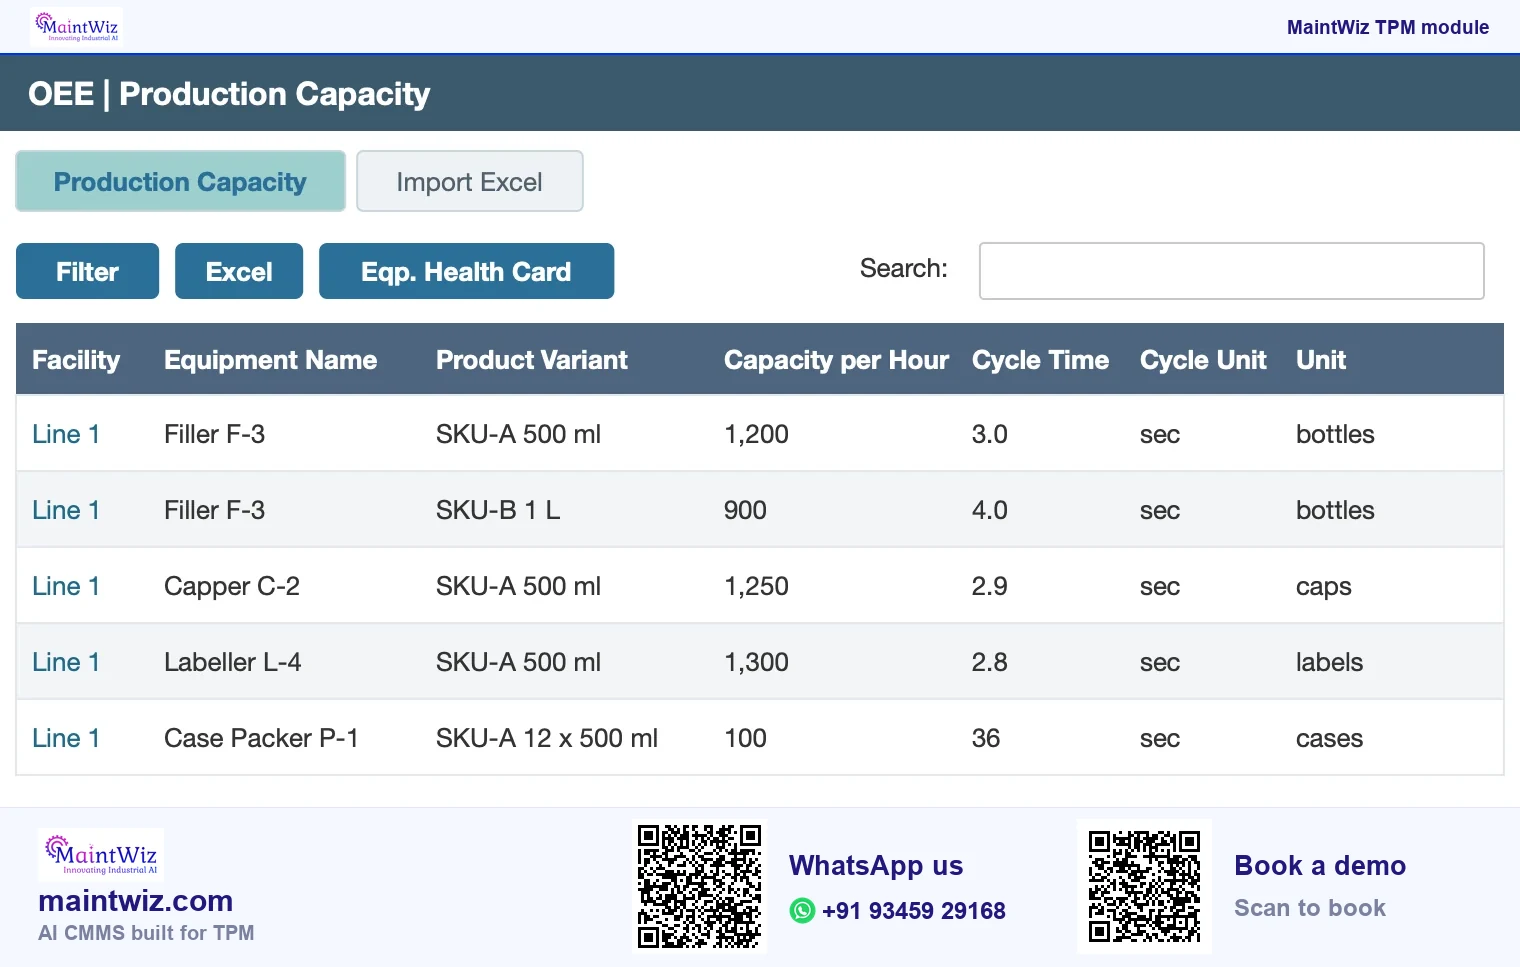
A calculator answers a question once. Measuring OEE every shift needs stops with reason codes, counts and an ideal rate per product, rolled up from equipment to line and plant. A spreadsheet can do this for a pilot; past that, what OEE software is matters, because it holds the same definitions for every equipment and every shift. In MaintWiz the production log entry holds the counts and stops for each shift, the capacity master holds the ideal rate by product, and the downtime report splits unplanned, planned and performance loss. See OEE software and how to improve OEE.
Worked cases with the calculator
Read each case by its lowest factor. In Case A, stops take 60 of the 120 lost minutes, so stops are the biggest loss: 60 of the 480 planned minutes are gone before a single part is made. In Case C, performance at 84.4% is the biggest loss, which points to reduced speed and minor stoppages. Case B is balanced, with quality at 95.0% the lowest factor, so its question is rework and rejects. It also shows how small losses multiply: three factors near 90% to 95% still leave OEE at 81.4%.
The same OEE can come from very different loss patterns, and each needs a different response. Where stops lead, attack changeover and minor stops first; where speed leads, check the ideal cycle time against the real running rate; where quality leads, trace the rejects to their cause. Run your own shift the same way: find the lowest factor, then ask which of the six big losses sits behind it.
What to do when the result looks too good
- Performance over 100%: the ideal cycle time is too slow, the counts include parts from another period, or stops are over-reported.
- Quality at exactly 100%: check whether rework and scrap are being counted or whether counts come from the good-parts counter only.
- Availability very high: check whether short stops are being logged at all.
- OEE above the best level you have ever seen: compare with an independent count before celebrating.
- Different shifts with very different results on the same equipment: check that they use the same definition.
From one equipment to a plant
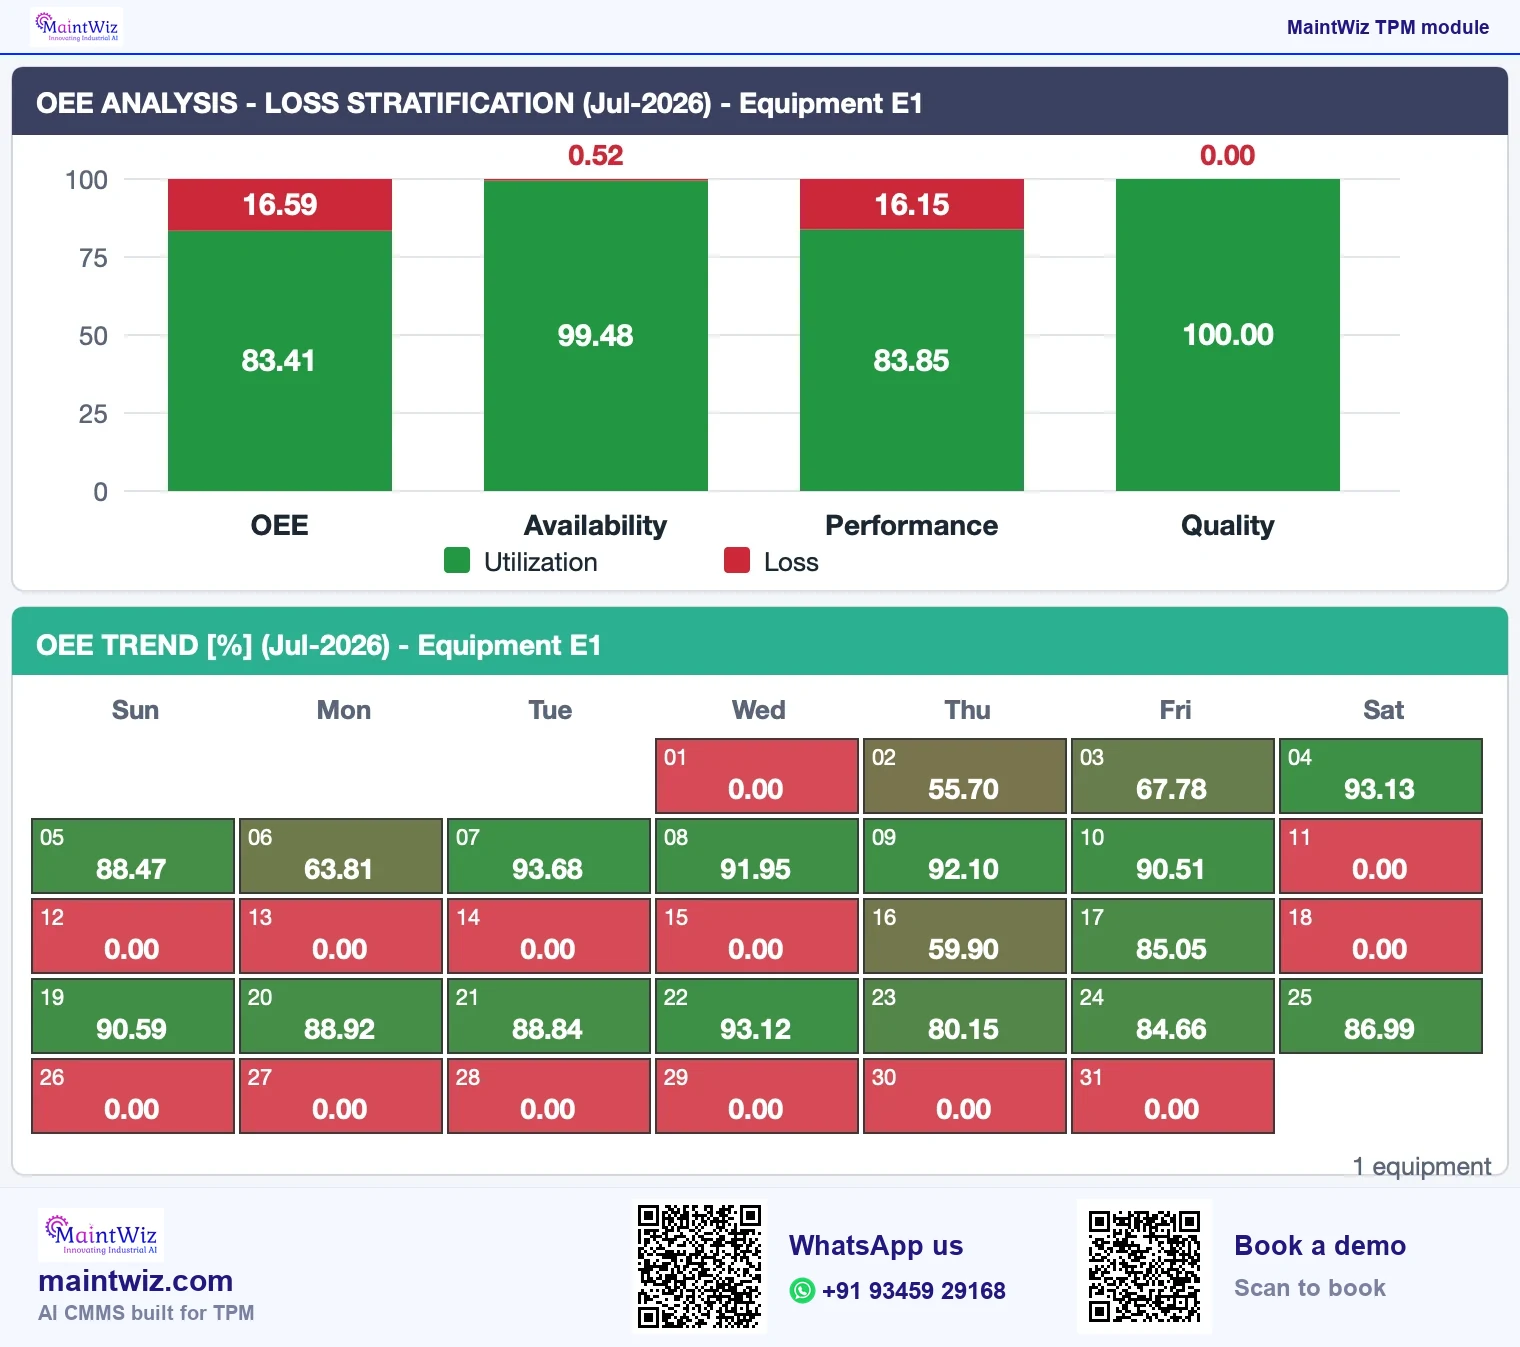
The calculator handles one equipment with up to two products. For a line or a plant, add the underlying times and divide once; averaging percentages gives small and large equipment the same weight. The roll-up workbook does this, and MaintWiz does the same roll-up from the shift logs, by planned time (Figure 5).
Next steps
Next steps
- Get the OEE workbook for mixed products and roll-ups.
- Rank what you lose: six big losses.
- Track OEE every shift: OEE software.
FAQ
Frequently asked questions
What OEE does the calculator give for the default inputs?
75.0%. The default shift is 480 planned minutes with 60 minutes of stops, a 0.5-minute ideal cycle and 720 good parts of 756, so availability is 87.5%, performance 90.0% and quality 95.2%. Change any one input and every step updates.
What do I enter as stops?
All time the equipment was not running during planned production time, under your downtime definition: breakdowns, changeovers, waiting. Planned breaks are left out of planned time.
Why is my performance above 100%?
Usually the ideal cycle time is set too slow, the counts do not match the period, or stops were over-reported. Check the ideal cycle time first, then the counts, then the stop times, and correct them before reporting the figure.
Can this calculator handle several products?
Yes, two. Tick the two-product box and enter each product's own ideal cycle time, total parts and good parts; the calculator weights by ideal time. For more than two products use the Excel workbook.
Does the calculator store my data?
No. The calculation runs in your browser and nothing you enter is sent anywhere or kept after you close the page. If you want a record, copy the result table into your own sheet or use the Excel workbook.
Can I use the calculator for a whole line?
Use it for one equipment or for the bottleneck of a line. For a line or plant, add planned time and the ideal time of good output across the equipment and divide once; the free roll-up workbook does this, and MaintWiz rolls OEE up from equipment to line and plant by planned time.
Is there an OEE calculator online and an OEE Excel template free?
Yes. The calculator above runs online with no sign-up, and the free OEE Excel template adds mixed products and roll-ups from equipment to line and plant, so one workbook covers the shift, the line and the plant.