
Key takeaways
- Six losses, three OEE factors: breakdowns and setup reduce availability; idling, minor stops and reduced speed reduce performance; defects and start-up yield reduce quality.
- The six-loss grouping maps each loss to an OEE factor; the JIPM list has eight equipment losses, the six big losses plus cutting-blade or tool change and scheduled shutdown, and 16 major losses in all.
- Log each stop with a reason code at the time; rank lost time, not event count, and work the biggest loss first.
- MaintWiz is an AI CMMS built for TPM: every stop is logged against a reason code and the lost-hours Pareto builds itself. All eight pillars, 5S, OEE, Kaizen and one point lessons run on one equipment list; operators capture on mobile, tags become work orders, IoT signals raise work orders and ePTW covers safety. The whole roll-out takes 6 to 8 weeks.
At a glance
The six big losses at a glance
| Loss | OEE factor | Typical example | Common causes to look for |
|---|---|---|---|
| Equipment breakdowns | Availability | A gearbox seizes and the line stops until it is repaired | Missed lubrication, wear, contamination, overload |
| Setup and adjustment | Availability | Changeover between products plus trial runs to get the settings right | Unwritten changeover steps, search for tools, adjustment by feel |
| Idling and minor stops | Performance | A sensor misreads and a jam is cleared by hand in under a minute | Jams, misfeeds, blocked sensors, material variation |
| Reduced speed | Performance | The line is run below its ideal rate to avoid jams or quality problems | Worn parts, poor condition, operator caution |
| Process defects and rework | Quality | Parts scrapped or reworked during steady production | Out-of-condition equipment, settings drift, material |
| Reduced yield at start-up | Quality | Scrap while a process stabilises after a stop or changeover | Warm-up, set-points not reached, unstable conditions |
The six big losses in the JIPM list of equipment losses
Loss number, OEE factor and a shop-floor example
- 1Equipment breakdownsA AvailabilityA gearbox seizes and the line stops until it is repaired
- 2Setup and adjustmentA AvailabilityA changeover plus trial runs to get the settings right
- 5Idling and minor stopsP PerformanceA jam is cleared by hand in under a minute
- 6Reduced speedP PerformanceThe line is run below its rated speed
- 7Process defects and reworkQ QualityParts scrapped in steady running
- 4Reduced yield at start-upQ QualityScrap while the process warms up
Numbers follow the JIPM list of 16 major losses; A availability, P performance, Q quality
 maintwiz.comAI CMMS built for TPM
 WhatsApp us
 +91 93459 29168
 Book a demo
Write down your own definitions of planned time, stops and rework before comparing figures.
Downloads
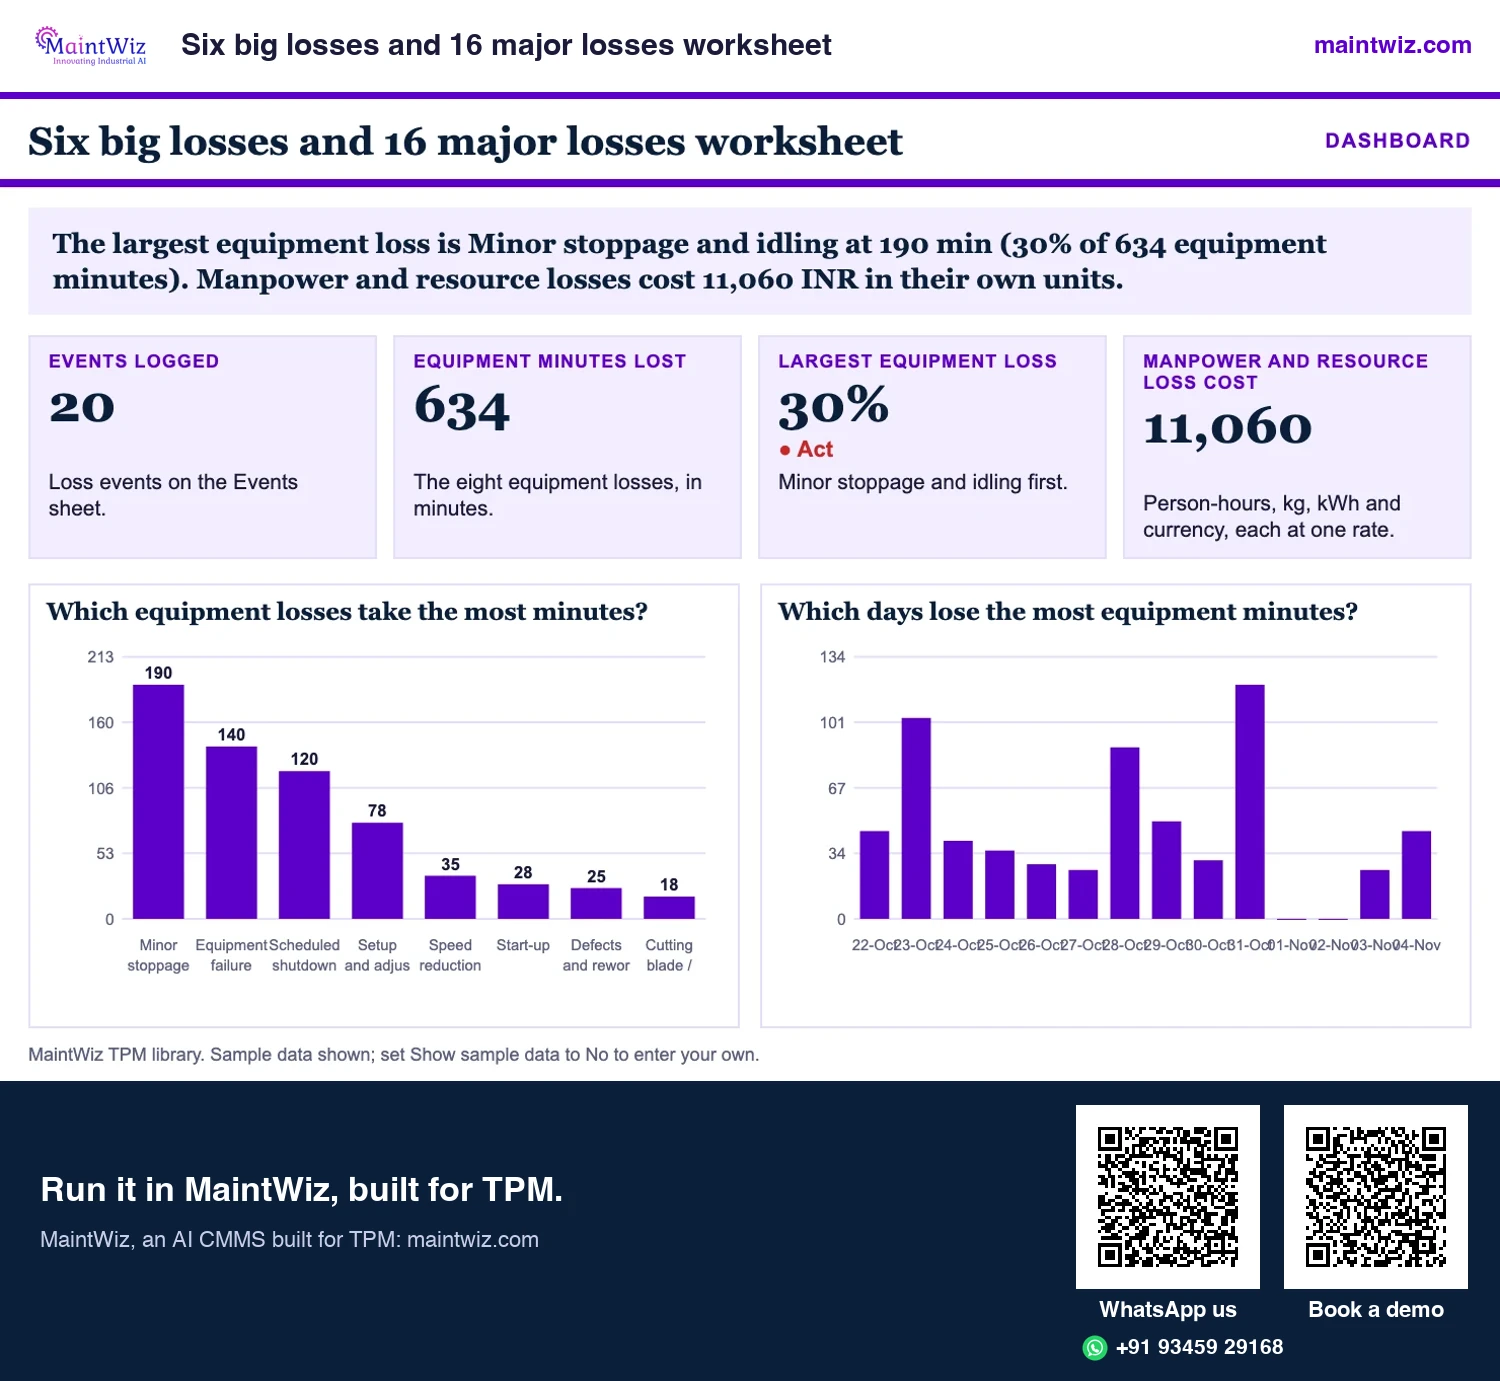
Six big losses worksheet, loss cost calculator and downtime code library (Excel)
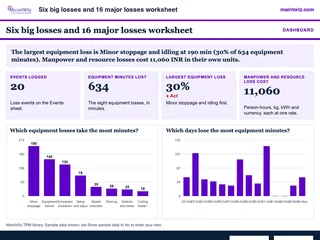 ExcelSix big losses and 16 major losses worksheet
Log loss events, rank the eight equipment losses in minutes
- Sheets
- Dashboard, Inputs, Lists, Events, Summary, Read me
- A4
- Version
- v1.2, 5 November 2026
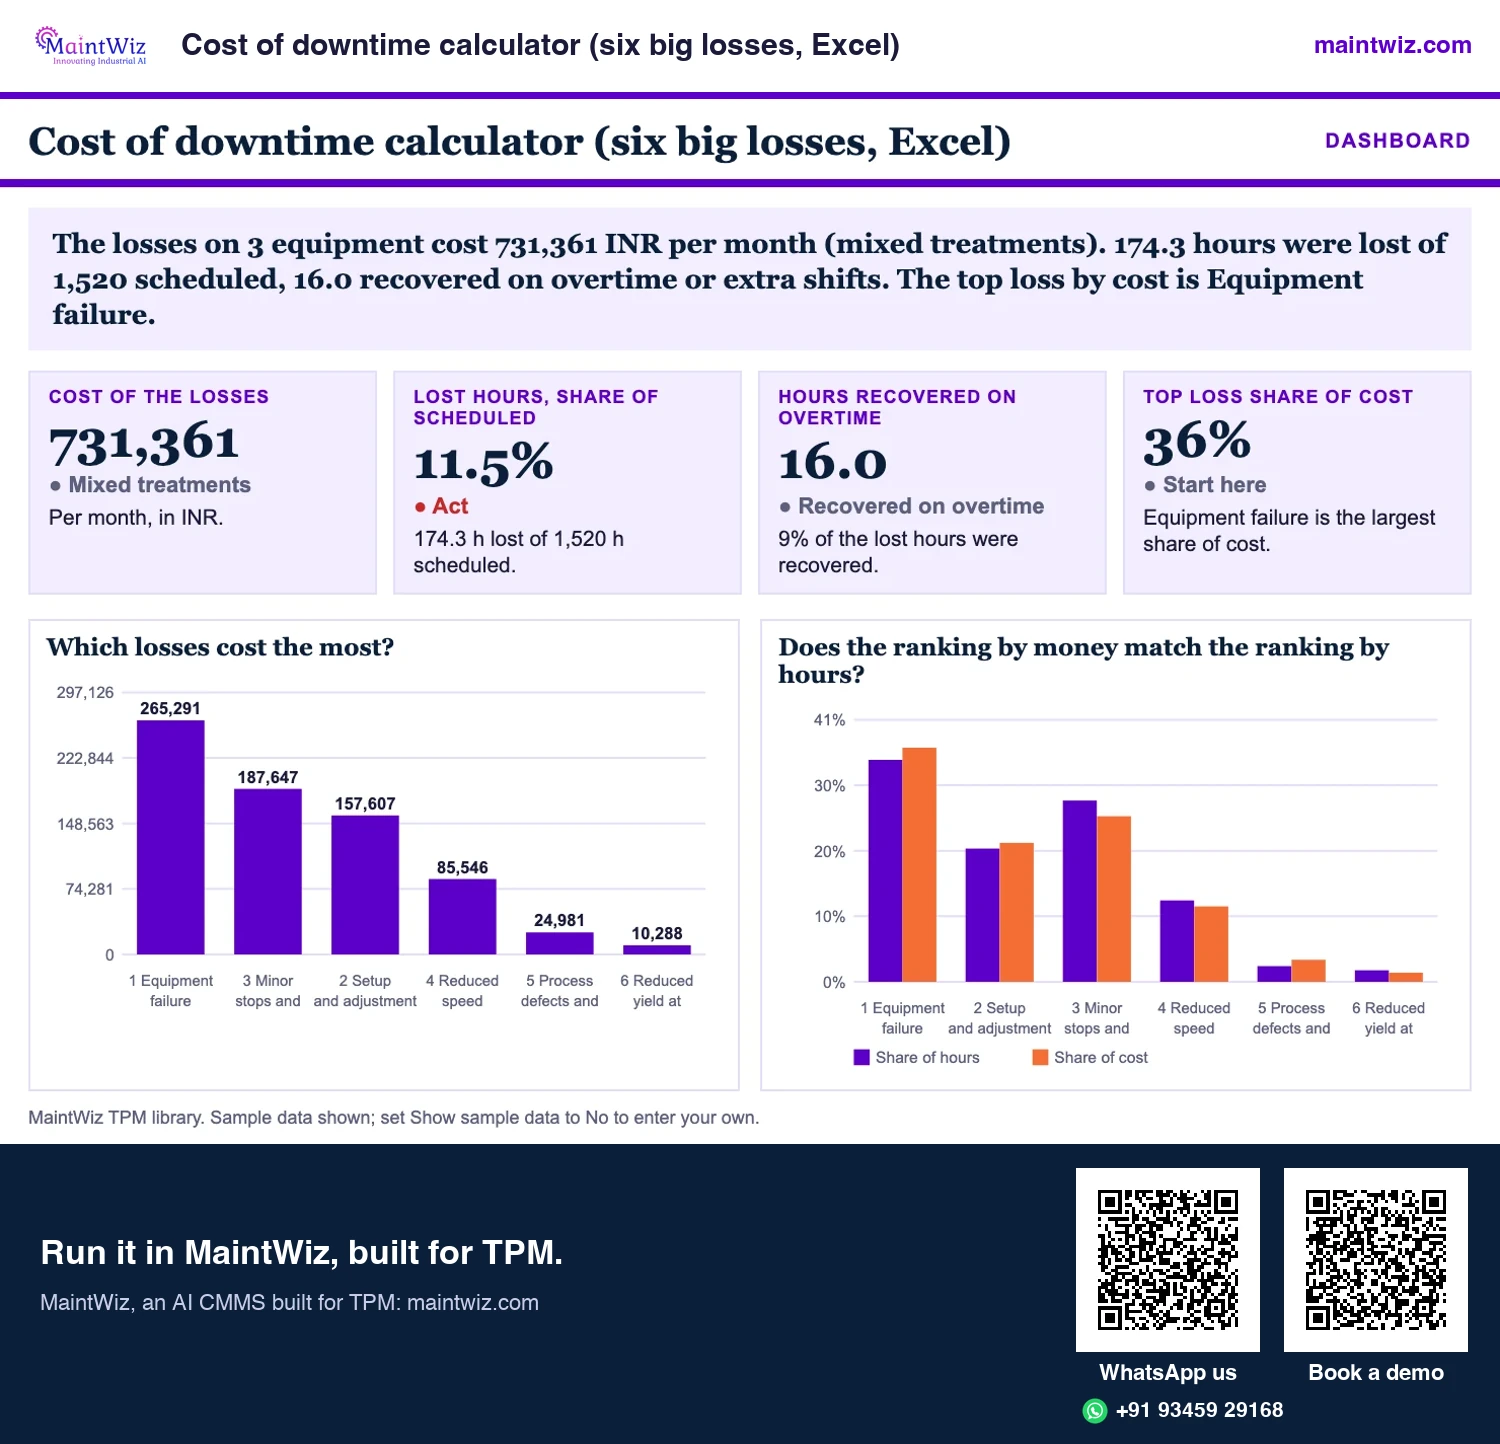
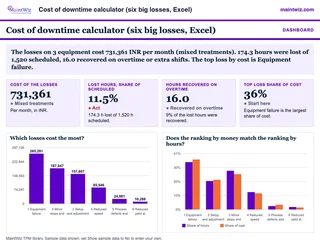 ExcelCost of downtime calculator (six big losses, Excel)
Turn hours lost to each of the six big losses into cost per line, with overtime recovery
- Sheets
- Dashboard, Inputs, Equipment, Results, Read me
- A4
- Version
- v1.2, 5 November 2026
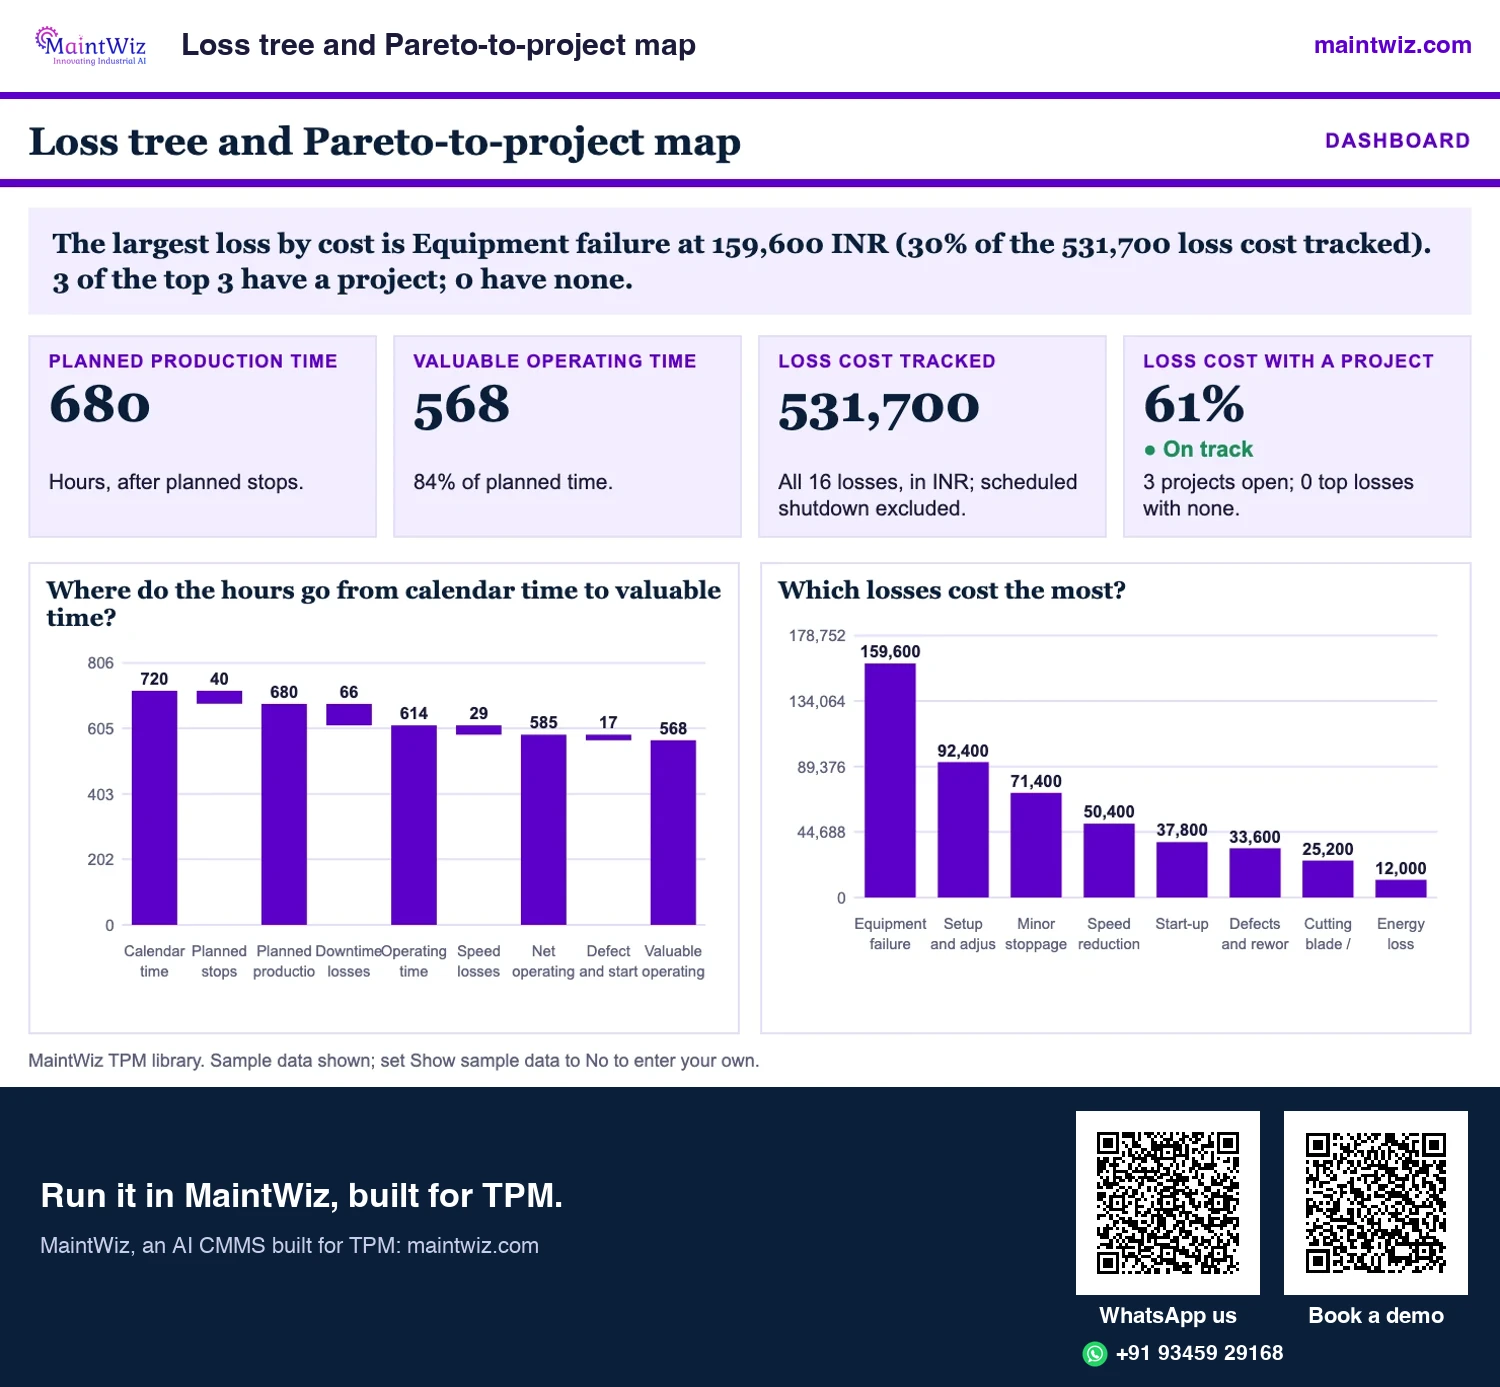
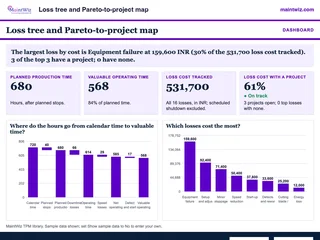 ExcelLoss tree and Pareto-to-project map
Build the loss tree from calendar time to valuable time, rank all 16 losses by cost
- Sheets
- Dashboard, Inputs, Tree, Project map, Pareto, Read me
- A4
- Version
- v1.1, 5 November 2026
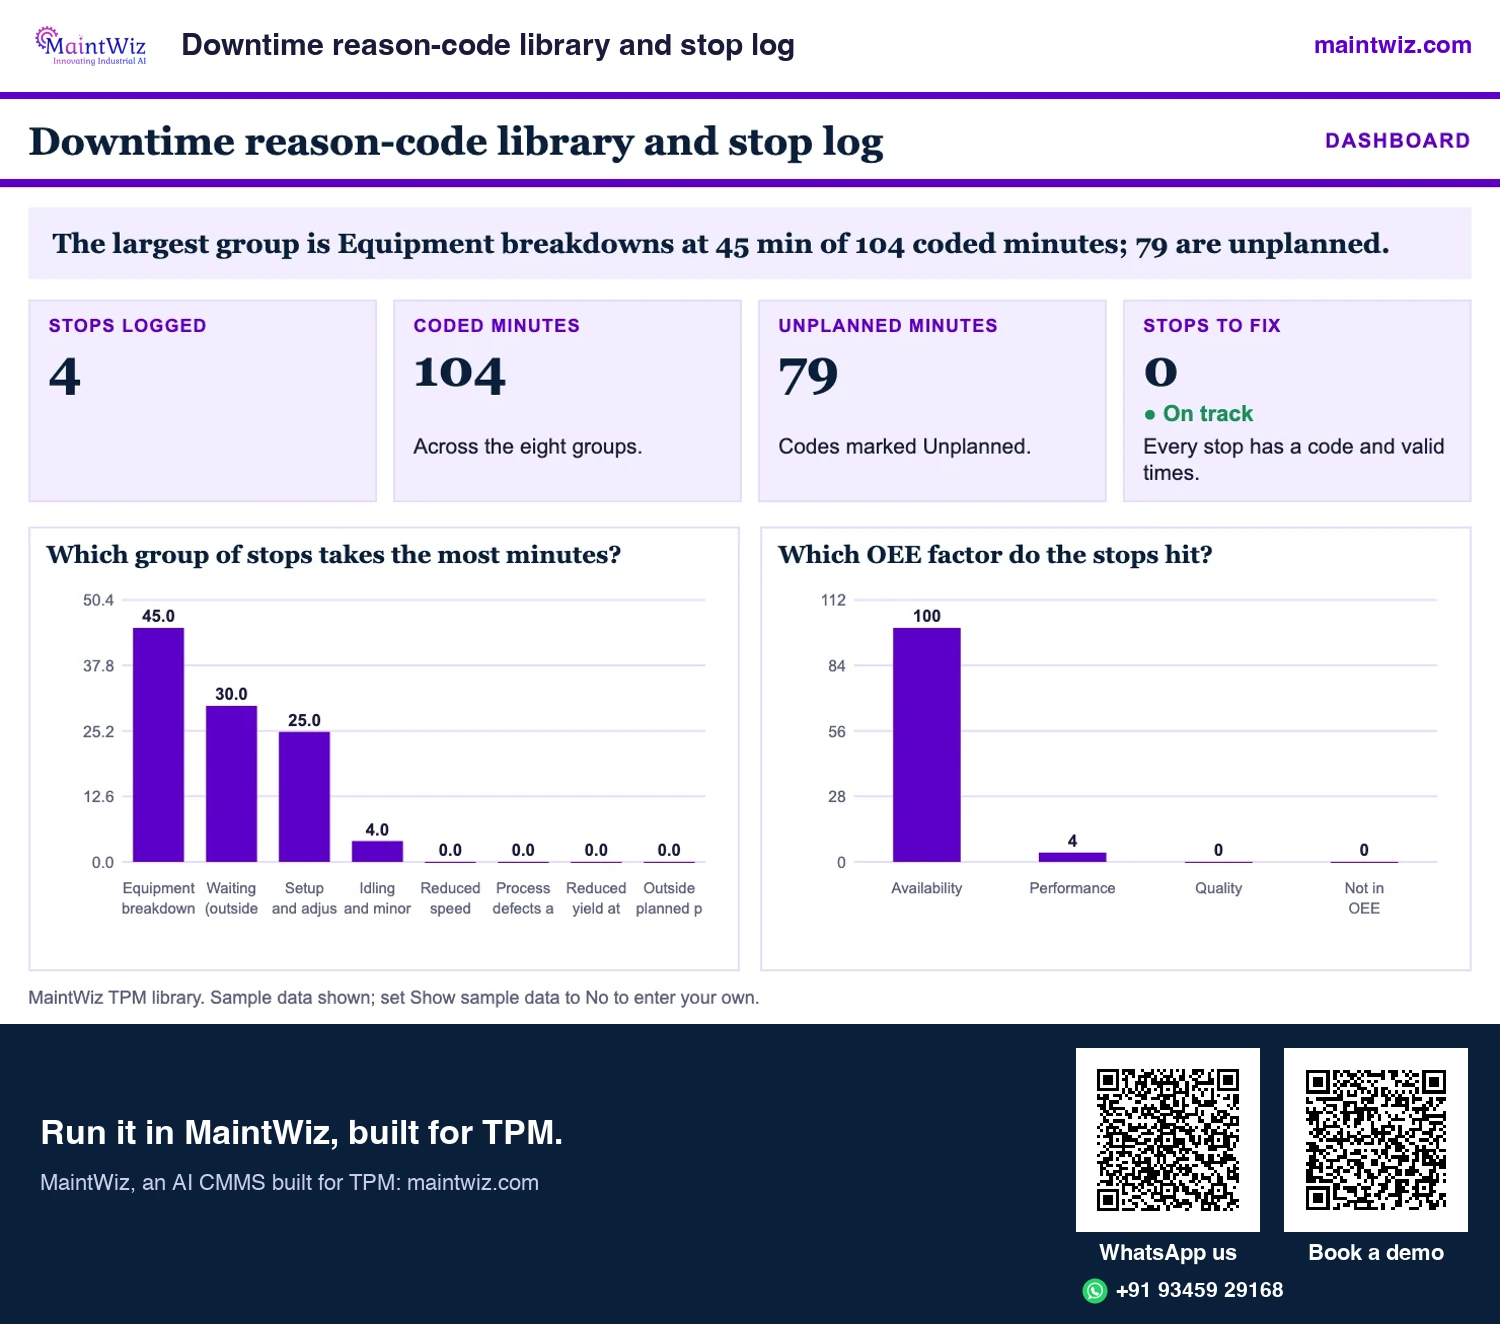
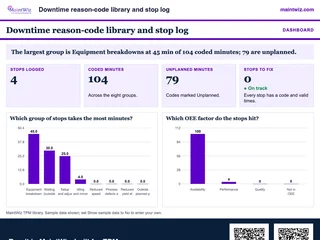 ExcelDowntime reason-code library and stop log
Start from 38 coded stop reasons with definitions, set a minor stop threshold
- Sheets
- Dashboard, Inputs, Codes, Stop log, Summary, Read me
- A4
- Version
- v1.1, 5 November 2026
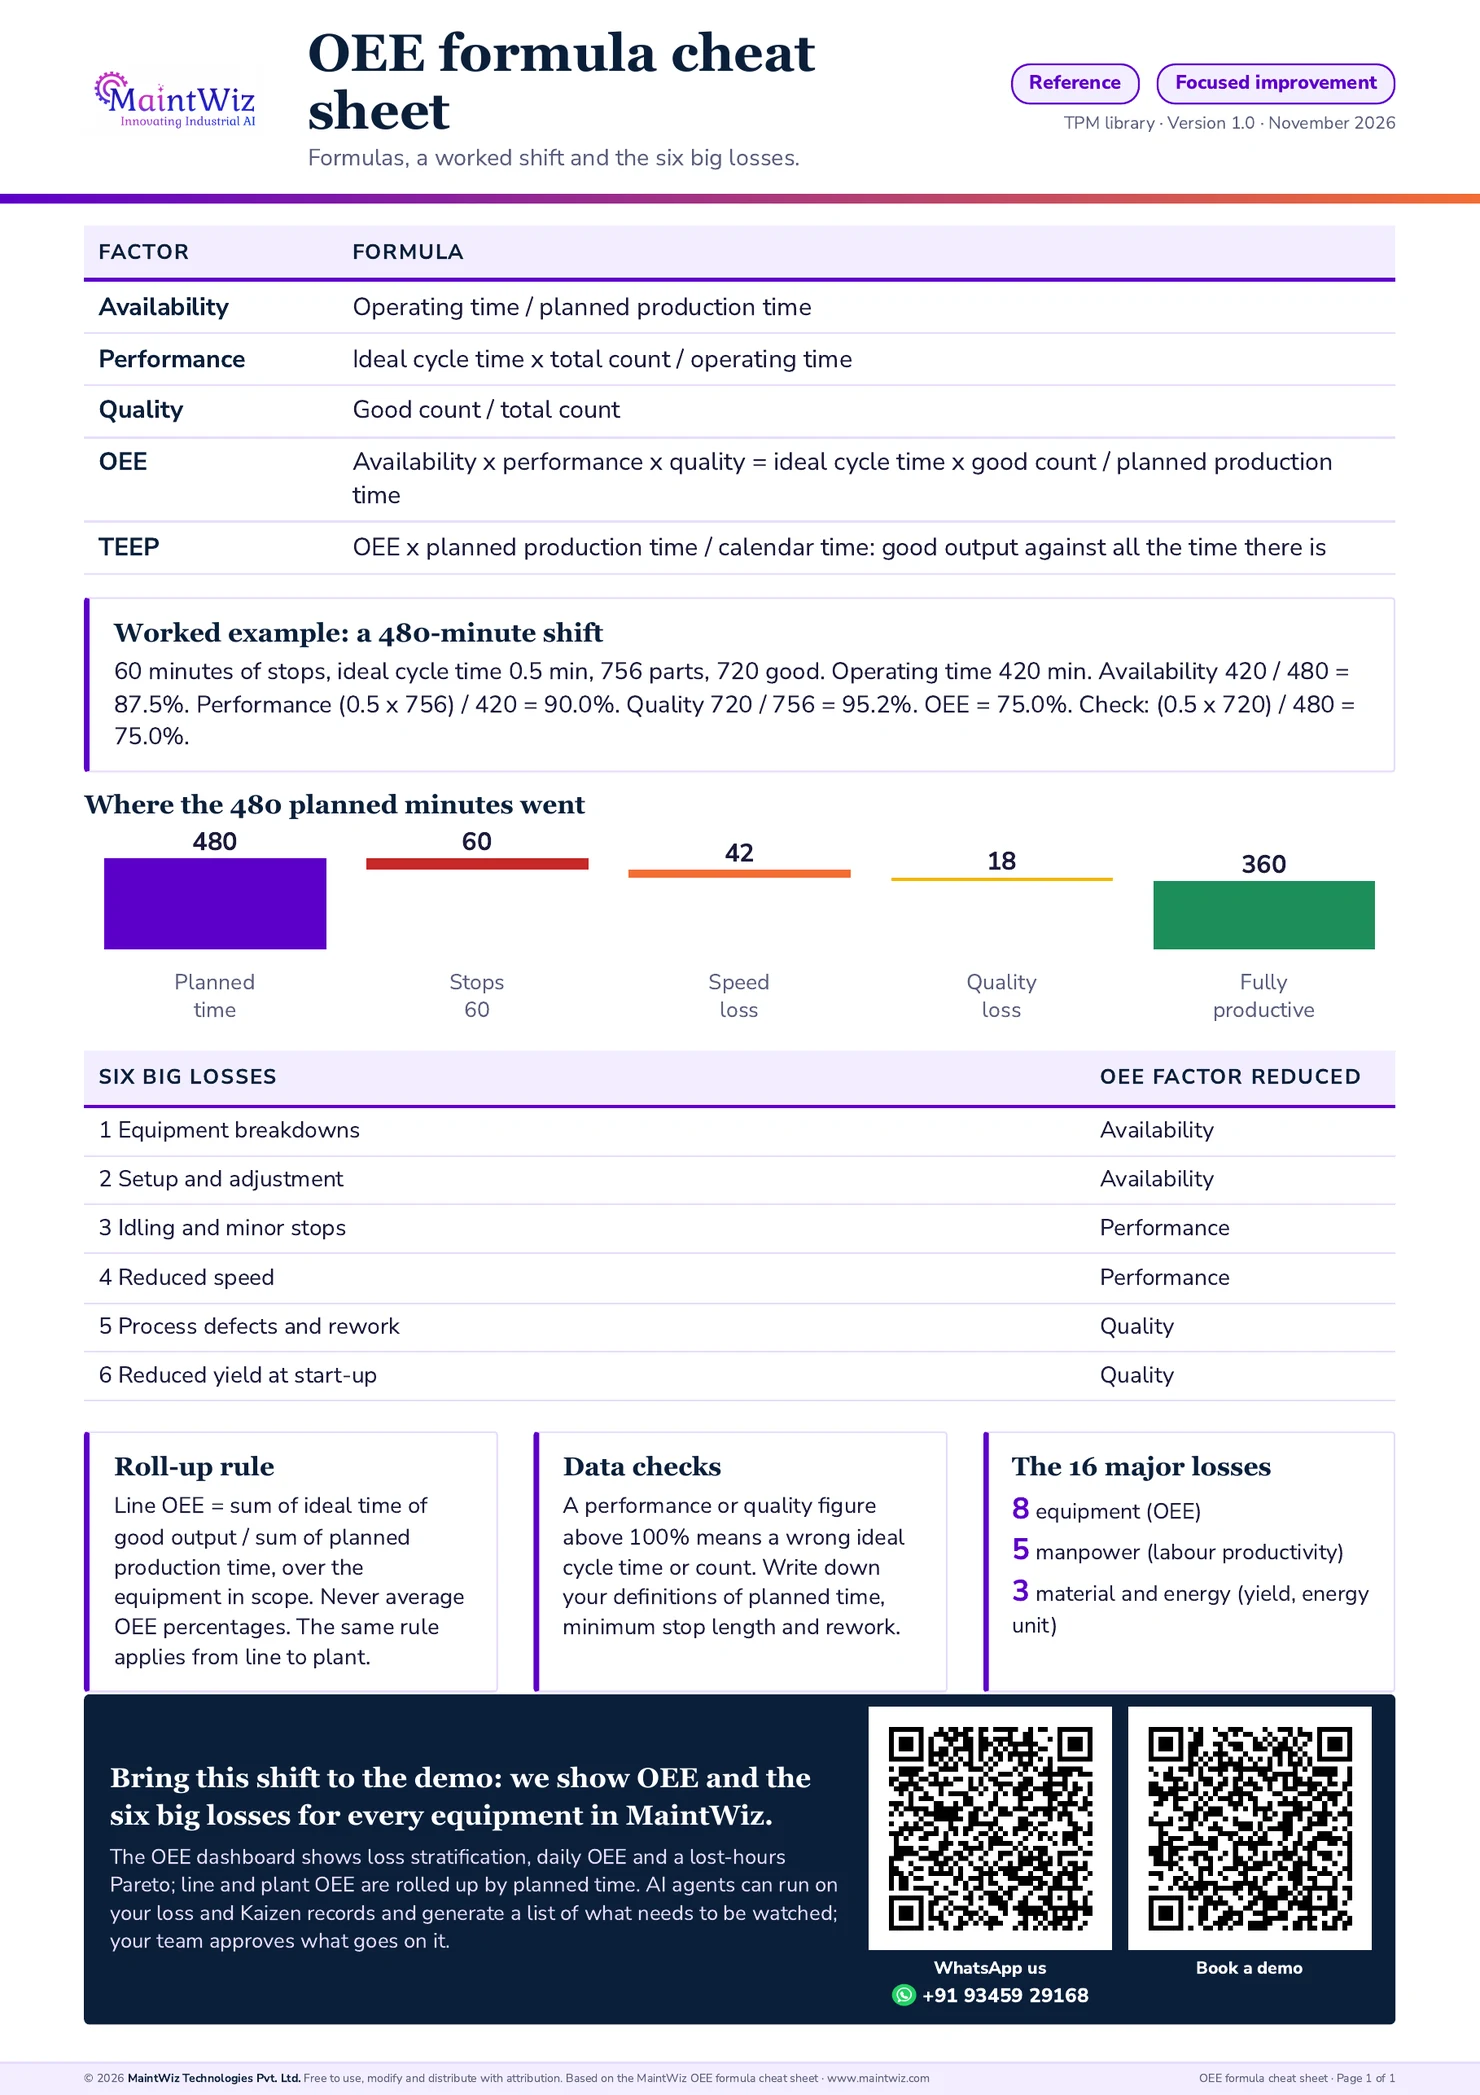
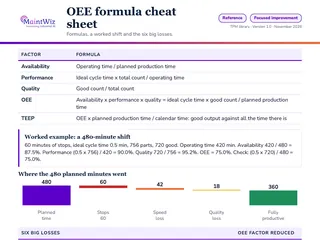 PDFOEE formula cheat sheet
Keep the OEE formulas, a worked 480-minute shift, the six big losses and the 16 major losses on one printable page
- Pages
- 1
- A4
- Created
- 5 November 2026
Availability losses
What are the availability losses?
Availability falls when equipment is not running during planned production time. Breakdowns are failures that stop the equipment and need repair; they are the loss most plants already count. Setup and adjustment is the time from the last good part of one product to the first good part of the next, including changeover, tooling, warm-up and trial runs. Setup is sometimes separated from adjustment.
Where to start: breakdown data usually exists in work orders, so a ranking by cause is quick. Setup time rarely exists in a usable form until someone measures it; timing three changeovers end to end often shows how much time is searching and waiting.
What are the performance losses?
Performance falls when equipment runs but produces less than the ideal rate. Idling and minor stops are short interruptions, often cleared by an operator without a work order, that no one logs; a stop must be defined by a threshold (for example, anything over a set number of seconds is logged) so that it can be counted. Reduced speed is running below the design or best demonstrated rate, often to avoid trouble.
These are the losses that stay hidden because each event looks small. An ideal cycle time that is realistic (not an average) is what makes them visible; see OEE performance.
In MaintWiz operators log each minor stop by type on a mobile device or at a terminal, MaintWiz can connect IoT, MES, SCADA, PLC and DCS sources, and the downtime report shows minor stops as performance loss.
What are the quality losses?
Quality falls when output is not good first time. Process defects and rework are scrap and reworked parts during normal production. Reduced yield at start-up is the scrap between restarting and reaching stable conditions; some definitions fold it into process defects. In OEE terms, rework is a loss even if the part is saved, because the time was already spent.
Quality losses are the link to the quality maintenance pillar: they are traced to equipment conditions and controlled there. See quality maintenance.
Worked example
Worked example: where one shift's minutes go
In a 480-minute shift with 60 minutes of stops, an ideal cycle time of 0.5 minute, 756 parts made and 720 good, OEE is 75.0%. The 120 minutes lost split into 60 for stops (availability), 42 for minor stops and reduced speed (performance) and 18 for rejects (quality). The largest single block is stops; the shape of the loss, not the 75.0%, tells the team where to look. Stops took half of the 120 lost minutes, so the first project goes there: split them into breakdowns and setup, and start with the larger. MaintWiz shows the same split from downtime reason codes, as a lost-hours Pareto by loss reason.
The 120 lost minutes of one 480-minute shift
Split by the six big losses
ILLUSTRATION
Stops 60 min: breakdowns 35 + setup 25
Minor stops and speed 42 min: 24 + 18
Rejects 18 min: defects 12 + start-up 6 (36 parts of 756)
480 = 120 lost minutes + 360 fully productive minutes
maintwiz.comAI CMMS built for TPMWhatsApp us+91 93459 29168Book a demoCost of downtime
How do you calculate the cost of downtime?
The cost of downtime is the margin not earned on the output you lost plus the cost that continues while the equipment is stopped. Multiply hours lost by the ideal rate and the margin per good unit, then add hours lost times crew labour, idle energy and overhead. Count only the share of lost output that was not made up later.
| Cost element | How it is worked out | What it captures |
|---|---|---|
| Hours lost | Losses 1 to 4: hours entered. Loss 5: rejected units divided by the ideal rate. Loss 6: starts times scrap per start divided by the ideal rate | Puts all six losses on one hours scale for ranking |
| Share not made up | 1 minus hours made up divided by hours lost, with hours made up capped at hours lost | Zero lost margin when all the output was recovered |
| Lost contribution | Hours lost x ideal rate x margin per good unit x share not made up | Margin not earned because sellable output was lost |
| Direct cost while stopped | Hours lost x (crew x labour rate + idle energy + overhead); rejects: units x (material + rework minutes / 60 x labour rate) | Cost that continues while output is lost |
| Cost per lost hour | Total cost divided by total hours lost | One figure to compare equipment and losses |
The free downtime and loss cost calculator applies these formulas to each piece of equipment and each of the six losses, so the ranking by hours can be set beside the ranking by cost. Rank by both: a short loss on a high-margin line can cost more than a long one on a low-margin line.
Cost of 10 lost hours on one equipment
Lost margin plus the cost that continues while stopped
ILLUSTRATION
- Lost hours10 h
- Ideal rate600 units per hour
- Margin per good unit2.50
- Share not made up later0.6
- Lost contribution10 × 600 × 2.50 × 0.6 = 9,000
- Crew4 × 15 per hour
- Idle energy20 per hour
- Overhead30 per hour
- Direct cost10 × (60 + 20 + 30) = 1,100
Total 9,000 + 1,100 = 10,100, or 1,010 per lost hour
maintwiz.comAI CMMS built for TPMWhatsApp us+91 93459 29168Book a demo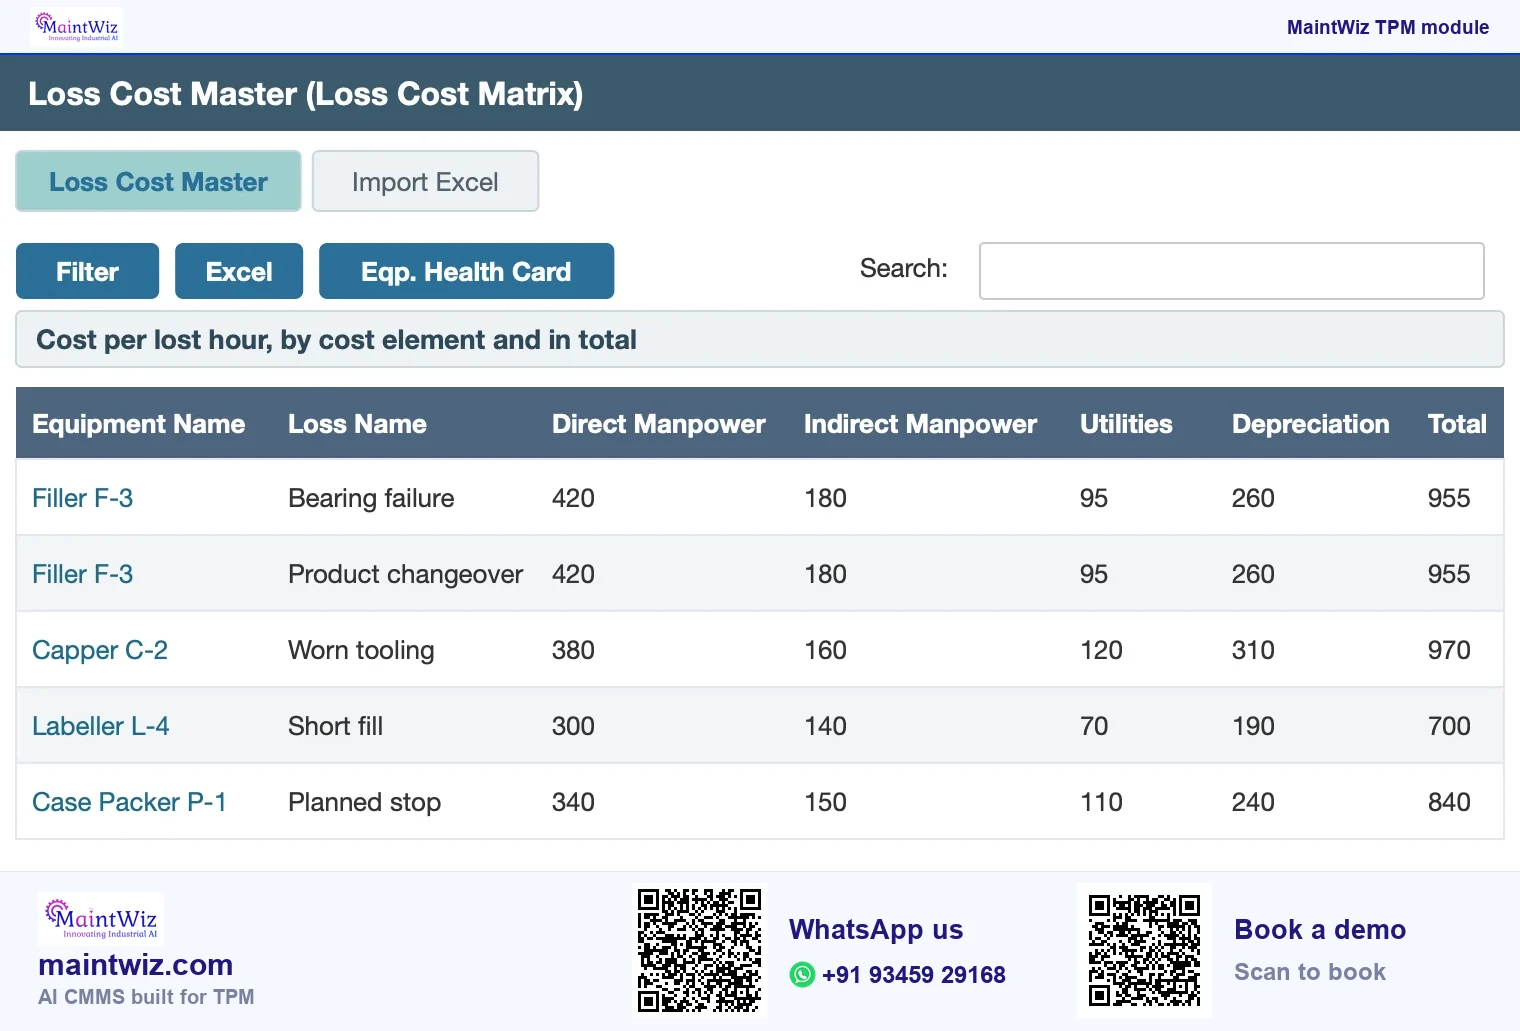
Put a cost on your own downtime. Get the downtime and loss cost calculator, or book a demo and see lost hours by loss reason per line.
16 major losses
From six to 16 major losses
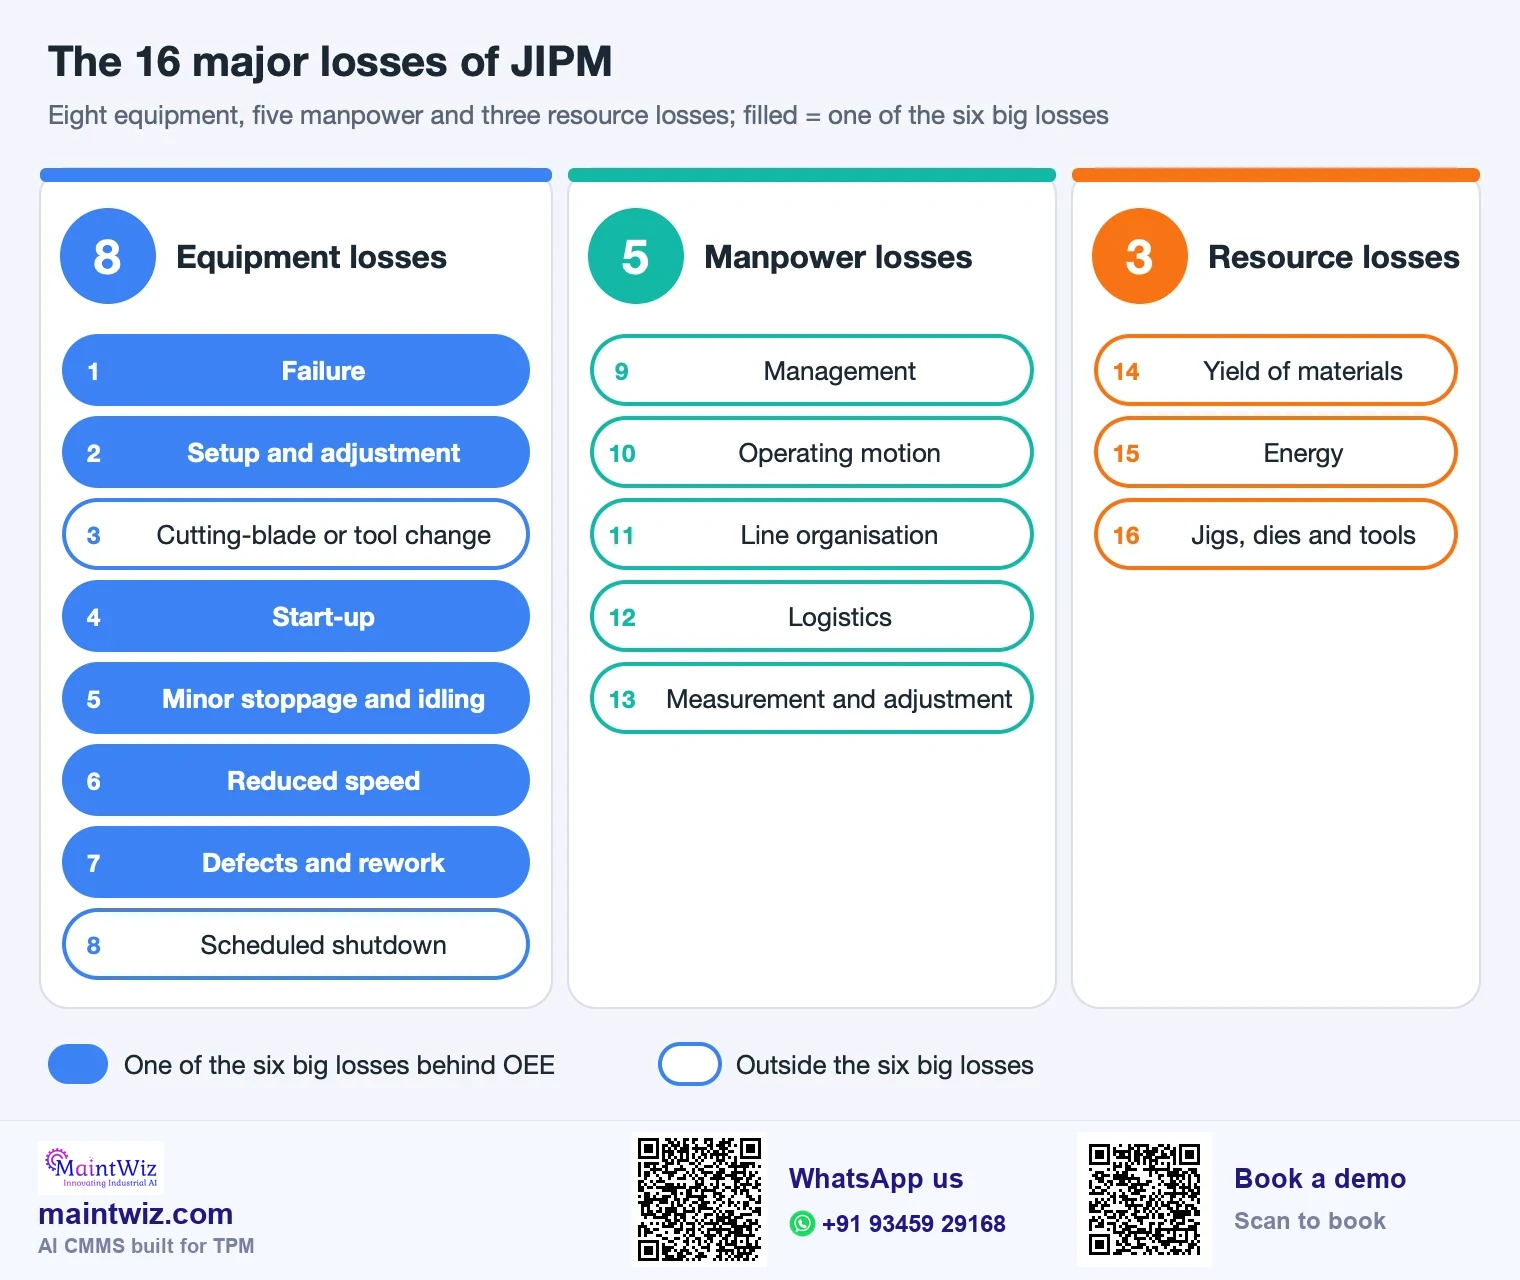
TPM frameworks extend the equipment view to 16 major losses in three groups. They are the loss list of focused improvement (Kobetsu Kaizen), one of the four core pillars that JIPM, the Japan Institute of Plant Maintenance, lists for TPM.
| Group | Losses |
|---|---|
| Equipment losses (8) | Failure; setup and adjustment; cutting-blade or tool change; start-up; minor stoppage and idling; reduced speed; defects and rework; scheduled shutdown |
| Manpower losses (5) | Management; operating motion; line organisation; logistics; measurement and adjustment |
| Resource losses (3) | Yield of materials; energy; jigs, dies and tools |
How the two lists relate
The six big losses are the equipment losses regrouped around OEE. The manpower and resource losses do not appear in OEE, which is why a plant with a good OEE can still have large hidden losses. Focused improvement uses the wider list; see Kobetsu Kaizen.
Log and rank
How do you log and rank the losses?
- Define the minimum stop that counts as downtime and write it down.
- Give every stop a reason code from a short list, entered at the time, with a free-text field only for new causes.
- Map each reason code to one of the six losses, so the roll-up is automatic.
- Rank lost time by loss and by cause, not by number of events: one long breakdown can outweigh fifty short stops.
- Review the ranking weekly with the team that owns the line and attach each top cause to an owner and a countermeasure.
The six big losses worksheet logs events and gives a Pareto by loss; once several lines report, what OEE software is becomes the practical question, because software keeps the six losses coded the same way on every equipment. MaintWiz holds the same fields in its OEE software.
Chronic performance and quality losses with several causes are analysed with P-M analysis.
What goes wrong when classifying losses?
- Counting planned stops (breaks, planned maintenance) as losses in one report and not another.
- Putting minor stops in breakdowns because they were not logged separately.
- Classifying changeover as planned and so hiding it.
- Using an average speed as the ideal rate, which removes the speed loss.
- Mixing event counts and time in the same Pareto.
- Treating the six losses as the whole list: manpower and resource losses sit outside OEE.
Which pillar attacks which loss?
| Loss | Pillar that works on it most directly |
|---|---|
| Breakdowns | Autonomous maintenance and planned maintenance |
| Setup and adjustment | Focused improvement (changeover reduction) |
| Idling and minor stops | Autonomous maintenance and focused improvement |
| Reduced speed | Focused improvement and planned maintenance |
| Defects and rework | Quality maintenance |
| Start-up yield | Quality maintenance and early equipment management |
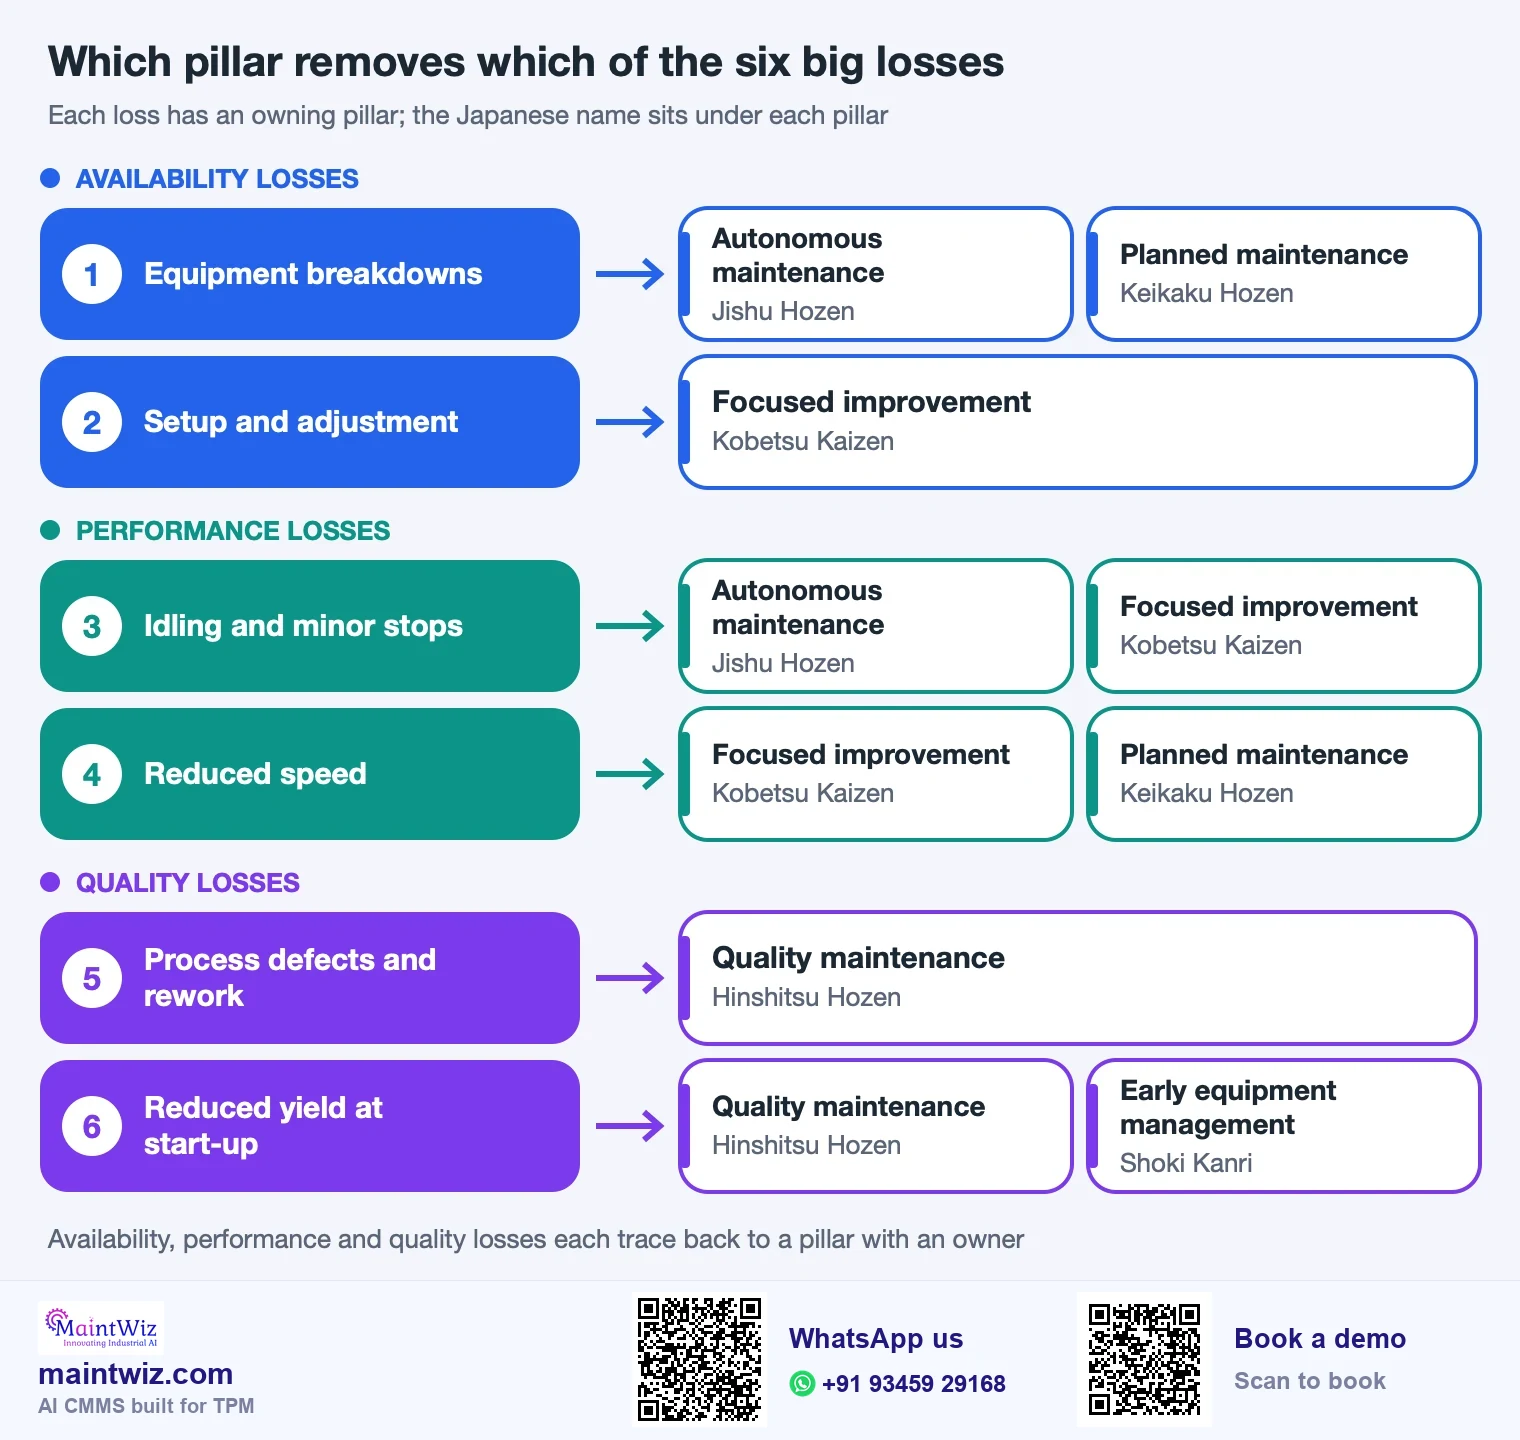
See the eight pillars for the full structure. How to improve OEE sets out a loss-by-loss method.
Six big losses as a lean manufacturing framework
In lean manufacturing the six big losses are used as a framework for finding equipment waste: each loss is a way that planned production time fails to become good output. Lean teams use the same list to choose where to run a Kaizen event or a changeover study, while TPM uses it to decide which pillar works on which loss. A changeover study on the largest setup loss is a typical first event.
ISO 22400-2:2014 defines OEE and the related manufacturing KPIs with their formulas; MaintWiz calculates OEE from the same planned time, stop and count records that rank the losses here.
By industry
Six big losses by industry: where each shows up
| Setting | Where the availability losses show | Where the performance losses show | Where the quality losses show |
|---|---|---|---|
| Packaging line | Format changeovers, filler or labeller breakdowns | Micro-stops at labellers and cartoners; line run below rated speed | Damaged packs, misprints, reject at the checkweigher |
| CNC machining | Tool failure, programme proving, fixture changes | Feed rate reduced to protect tools; short stops for chips | Out-of-tolerance parts, first-off scrap after tool changes |
| Injection moulding | Mould change, hot-runner faults | Cycle time extended to avoid flash; short jams at the take-out | Short shots, flash, start-up scrap while the mould reaches temperature |
| Continuous process | Trips and unplanned shutdowns | Rate held below ideal throughput | Off-specification product during start-up and grade change |
MaintWiz logs each stop against a reason code at the machine, so a packaging line, CNC cell or moulding press shows its own pattern in the lost-hours Pareto.
Loss Pareto
How to read a loss Pareto
A Pareto chart ranks loss categories or causes by lost time, largest first, with a cumulative line. Read it from the left: the first one or two bars usually explain a large part of the total, so they are the first projects. Check three things before acting. Is the data complete (are minor stops being logged)? Are the categories mutually exclusive (a stop counted once)? Is the period long enough to show a pattern, not a single bad week?
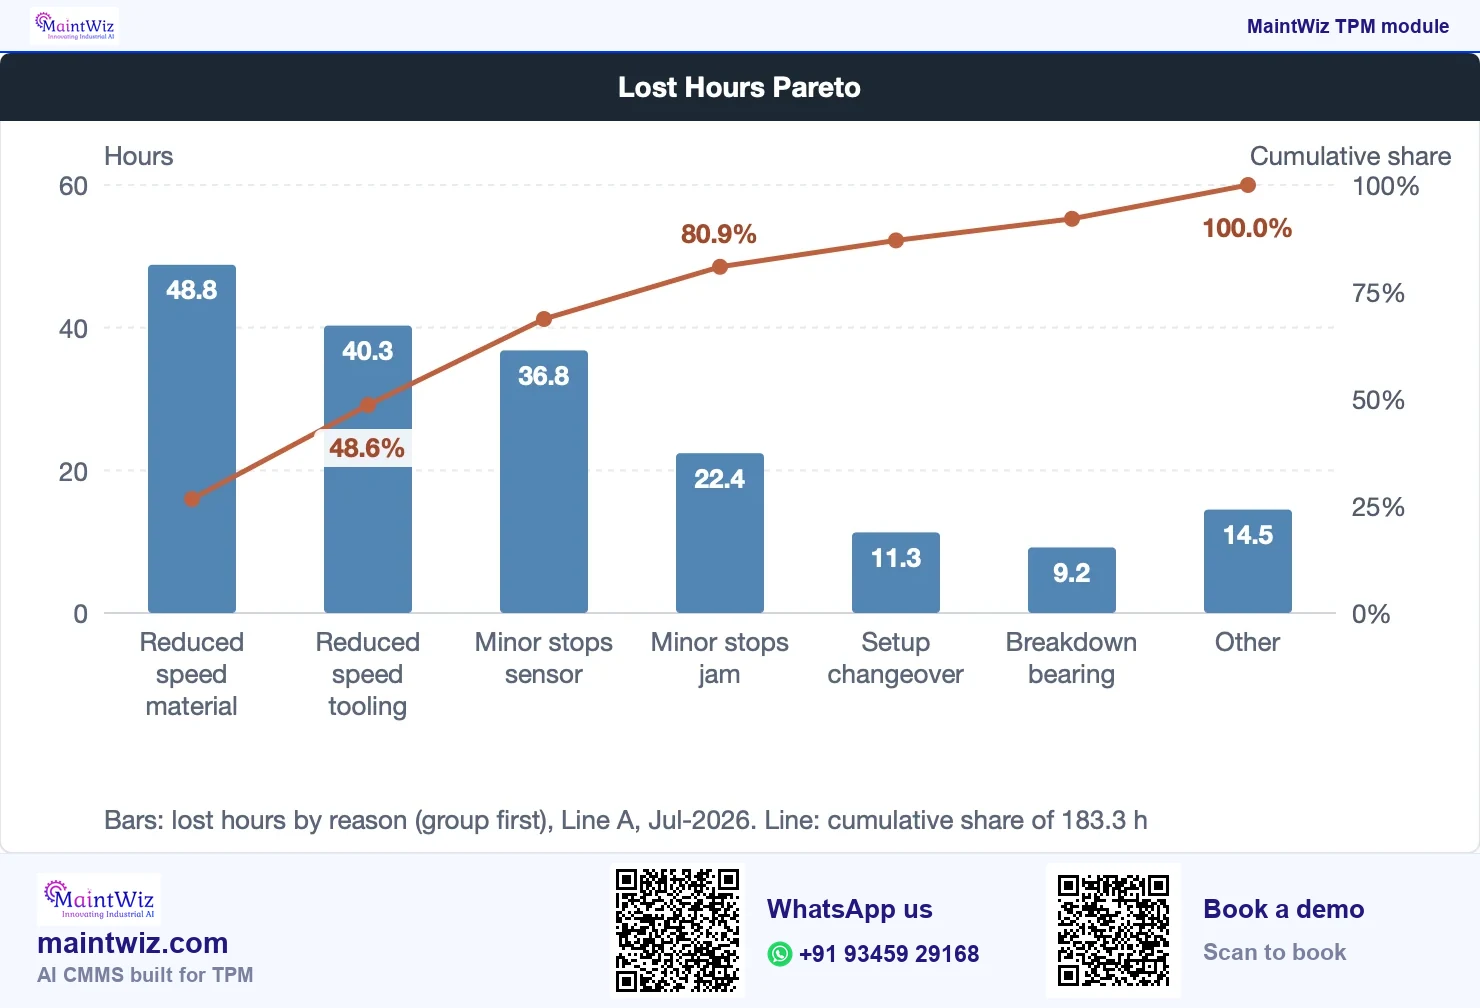
MaintWiz OEE software shows loss stratification per equipment, daily OEE and this lost-hours Pareto, built from the reason codes operators enter at the machine (downtime reason codes). Book a demo with your last month of downtime data; pricing is quoted on request.
After the first project
After the first project, redraw the Pareto: the order changes as losses are removed. How to improve OEE describes the loop.
What are the questions to ask for each loss?
| Loss | Questions for the team |
|---|---|
| Breakdowns | Which failure modes repeat? What did the last inspection miss? Is the cause a condition operators could have detected? |
| Setup and adjustment | Which steps could be done while the machine runs? What is searched for? Which adjustments could be fixed by design? |
| Idling and minor stops | What is the commonest jam or misfeed? What does the operator do to clear it? Why does it recur? |
| Reduced speed | Why is the line run below ideal? Is the ideal right? What condition would allow full speed? |
| Defects and rework | Which conditions affect the defect? Were they in standard when it occurred? |
| Start-up yield | How long to stable? What is adjusted during warm-up? What could be preset? |
FAQ
Frequently asked questions
What are the six big losses in TPM?
Equipment breakdowns, setup and adjustment, idling and minor stops, reduced speed, process defects and rework, and reduced yield at start-up. They group the equipment losses that stop planned production time from becoming good output, and they map to OEE.
How do the six big losses map to OEE?
Breakdowns and setup and adjustment reduce availability; idling and minor stops and reduced speed reduce performance; process defects and rework and reduced yield at start-up reduce quality. Each OEE factor therefore has two losses behind it.
What are the 16 major losses in TPM?
The 16 major losses are 8 equipment losses, 5 manpower losses and 3 resource losses. The six big losses are the equipment losses regrouped around OEE, so the wider list adds the manpower and resource losses that OEE does not show.
Why do some sources list eight equipment losses?
The JIPM list has eight equipment losses: the six big losses plus cutting-blade or tool change and scheduled shutdown. Setup and adjustment stay one loss. The six-loss form groups the equipment losses under availability, performance and quality so that each maps to an OEE factor.
What is the difference between a minor stop and a breakdown?
A minor stop is a short interruption, usually cleared without a repair work order. A breakdown is a failure that needs repair. Plants set a threshold in seconds or minutes to separate them.
What does each of the six big losses cost?
Multiply the lost hours by the ideal rate and the margin per good unit, count only output that was not made up later, and add the costs that continue while the equipment is stopped. In the worked example 10 lost hours cost 10,100, or 1,010 per lost hour; the MaintWiz loss cost master holds these rates.
Sources
Sources
- JIPM, About TPM https://www.jipmglobal.com/about/tpm/
- ISO 22400-2:2014, Automation systems and integration: Key performance indicators (KPIs) for manufacturing operations management, Part 2: Definitions and descriptions https://www.iso.org/standard/54497.html