
Key takeaways
- Measure results (OEE, MTBF, MTTR) and the routines that produce them (tags closed, PM compliance, audits passed, training delivered).
- MTBF = operating time between failures / number of failures; MTTR = total repair time / number of repairs; both depend on what you count as a failure.
- PQCDSM stands for productivity, quality, cost, delivery, safety and morale; it widens the view beyond equipment.
- Fix each definition once and keep it: changing definitions mid-programme destroys trends.
- MaintWiz, an AI CMMS built for TPM, holds these measures on a dashboard for each pillar, with OEE rolled up from equipment to line and plant.
KPIs
Which KPIs does TPM use?
| Metric | Formula (common form) | Source data | Pillar it informs |
|---|---|---|---|
| OEE | Availability x performance x quality | Planned time, stops, counts, ideal rate | Focused improvement, all |
| MTBF | Operating time between failures / number of failures | Work orders with start and end of each failure | Planned maintenance, autonomous maintenance |
| MTTR | Total repair time / number of repairs | Work orders with repair times | Planned maintenance |
| Breakdown frequency | Failures per period per equipment | Work orders | Planned maintenance |
| PM compliance | Planned tasks completed on time / planned tasks due | PM schedule and completions | Planned maintenance |
| Planned maintenance backlog | Open planned work, in hours or tasks, against capacity | Work order system | Planned maintenance |
| Planned to unplanned work ratio | Planned work hours / total maintenance hours | Work orders | Planned maintenance |
| Tags raised and closed on time | Tags closed by target date / tags due | Abnormality register | Autonomous maintenance |
| Step audit score | Points scored / maximum points for the step | Step-gate audit | Autonomous maintenance |
| 5S audit score | Points scored / maximum points by zone | 5S audit | 5S foundation |
| Rejection rate and repeat defects | Rejected units / produced units; repeat defects by cause | Quality records | Quality maintenance |
| Training hours against plan | Hours delivered / hours planned; skills gaps closed | Training records | Education and training |
| Near misses closed | Near misses closed on time / reported | Incident register | Safety, health and environment |
Each MaintWiz pillar dashboard clicks through to the tags, work orders and audits behind the figure.
| KPI | Where it shows in MaintWiz |
|---|---|
| OEE with availability, performance and quality | OEE equipment view, rolled up to line and plant by planned time |
| Lost hours by loss | OEE downtime report and lost-hours Pareto: unplanned, planned and performance loss |
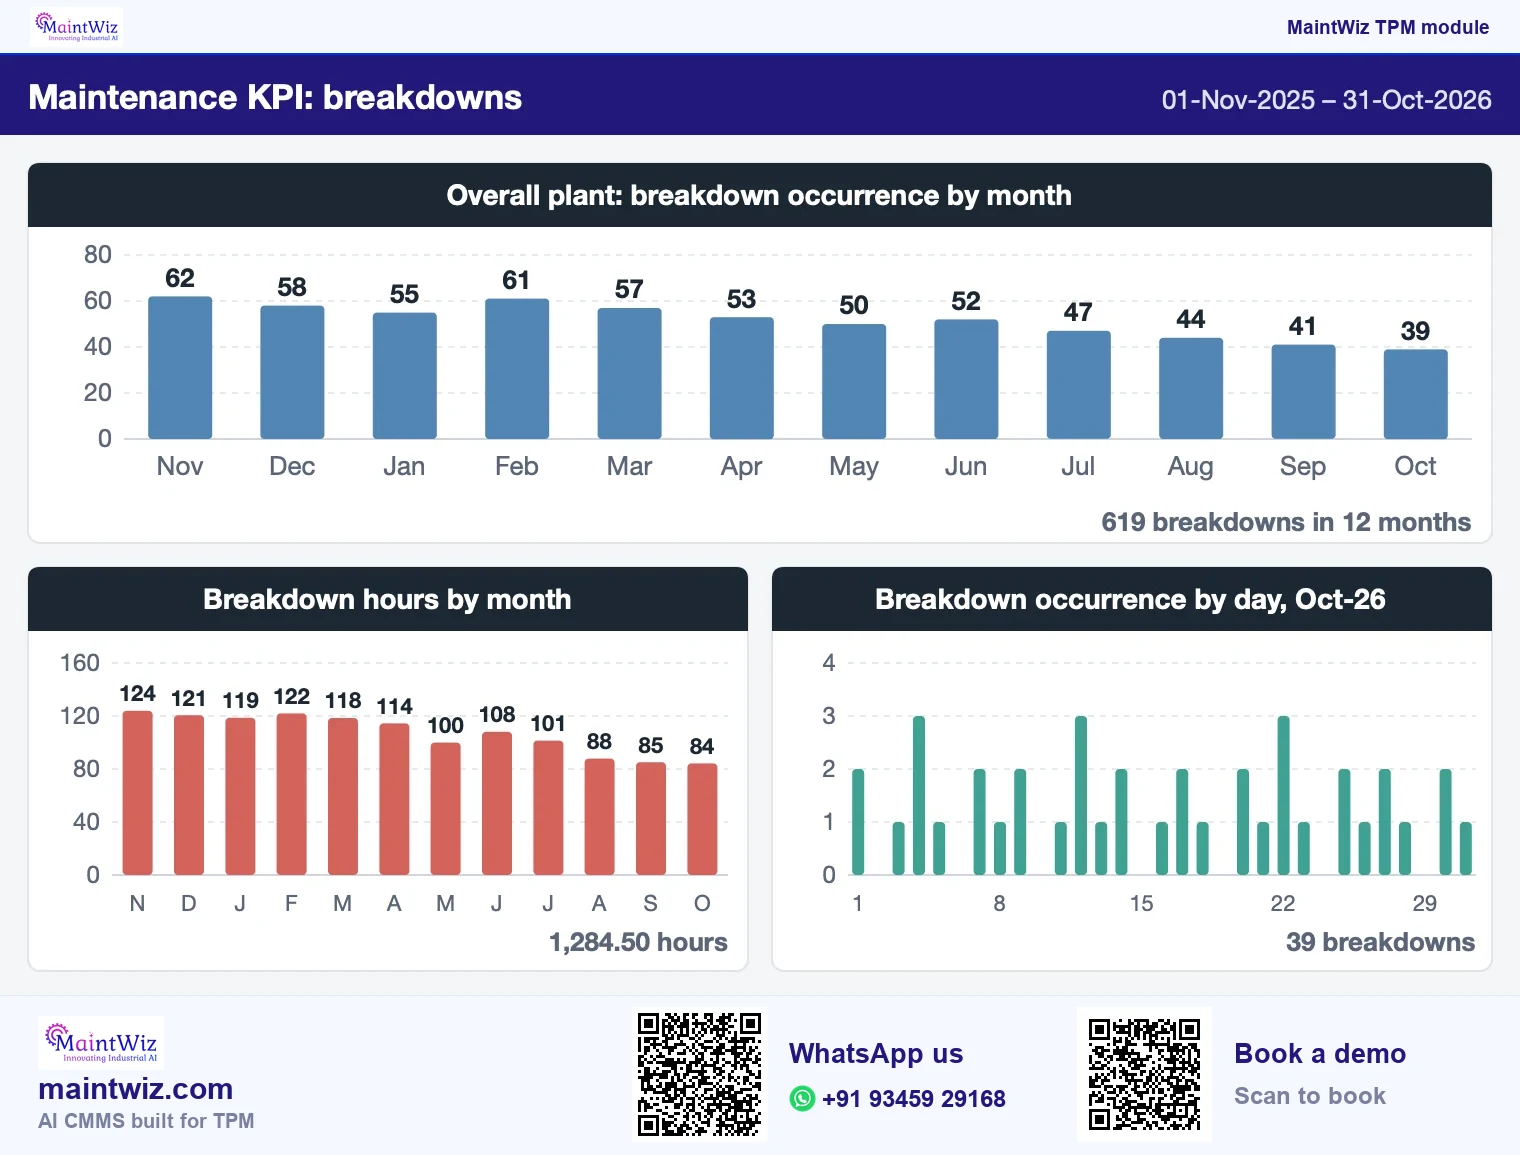
| Breakdown count and hours | KPI dashboard, by month and by day, from work orders |
| PM compliance | Maintenance dashboard: PM checklist compliance, closed against open |
| Tags raised and closed | Jishu Hozen dashboard: tags by colour, closure and contamination sources |
| Rejection RCA compliance | Quality maintenance dashboard |
| Training sessions and hours | Education and training dashboard |
| 5S compliance | 5S dashboard: compliance by month and by zone |
Three groups are visible in the table: equipment results, maintenance-system performance, and the routines that sit behind them. Report all three, because results lag behind the routines. OEE is one measure inside a TPM scorecard, not TPM itself; see OEE versus TPM (Figure 1).
TPM KPIs by pillar
Measure results and the routines that produce them: KPIs that inform each TPM pillar
Jishu Hozen
- Tags closed on time
- Step audit score
- 5S audit score
Keikaku Hozen
- MTBF and MTTR
- Breakdown frequency
- PM compliance and backlog
Kobetsu Kaizen and Hinshitsu Hozen
- OEE with its three factors
- Rejection rate and repeat defects
Kyoiku Kunren and Anzen Eisei Kankyo
- Training hours against plan
- Near misses closed
Shoki Kanri
- Vertical start-up time
- MP sheets closed
Office TPM
- Office tags closed
 maintwiz.comAI CMMS built for TPM
 WhatsApp us
 +91 93459 29168
 Book a demo
Read PM compliance together with failures
PM compliance (High to Low)
Failures and corrective work (Low to High)
High compliance, low failures
Working
keep the plan and review intervals
High compliance, high failures
Tasks are wrong or poorly done
review task content and quality
Low compliance, low failures
Over-maintained or lucky
check criticality before relaxing
Low compliance, high failures
Plan not being done
fix scheduling and resources
maintwiz.comAI CMMS built for TPMWhatsApp us+91 93459 29168Book a demoISO 22400-2:2014 defines OEE and the other manufacturing KPIs with their formulas, which gives every measure on a TPM scorecard one written definition.
Downloads
TPM KPI dashboard (Excel), metric dictionary and monthly review pack
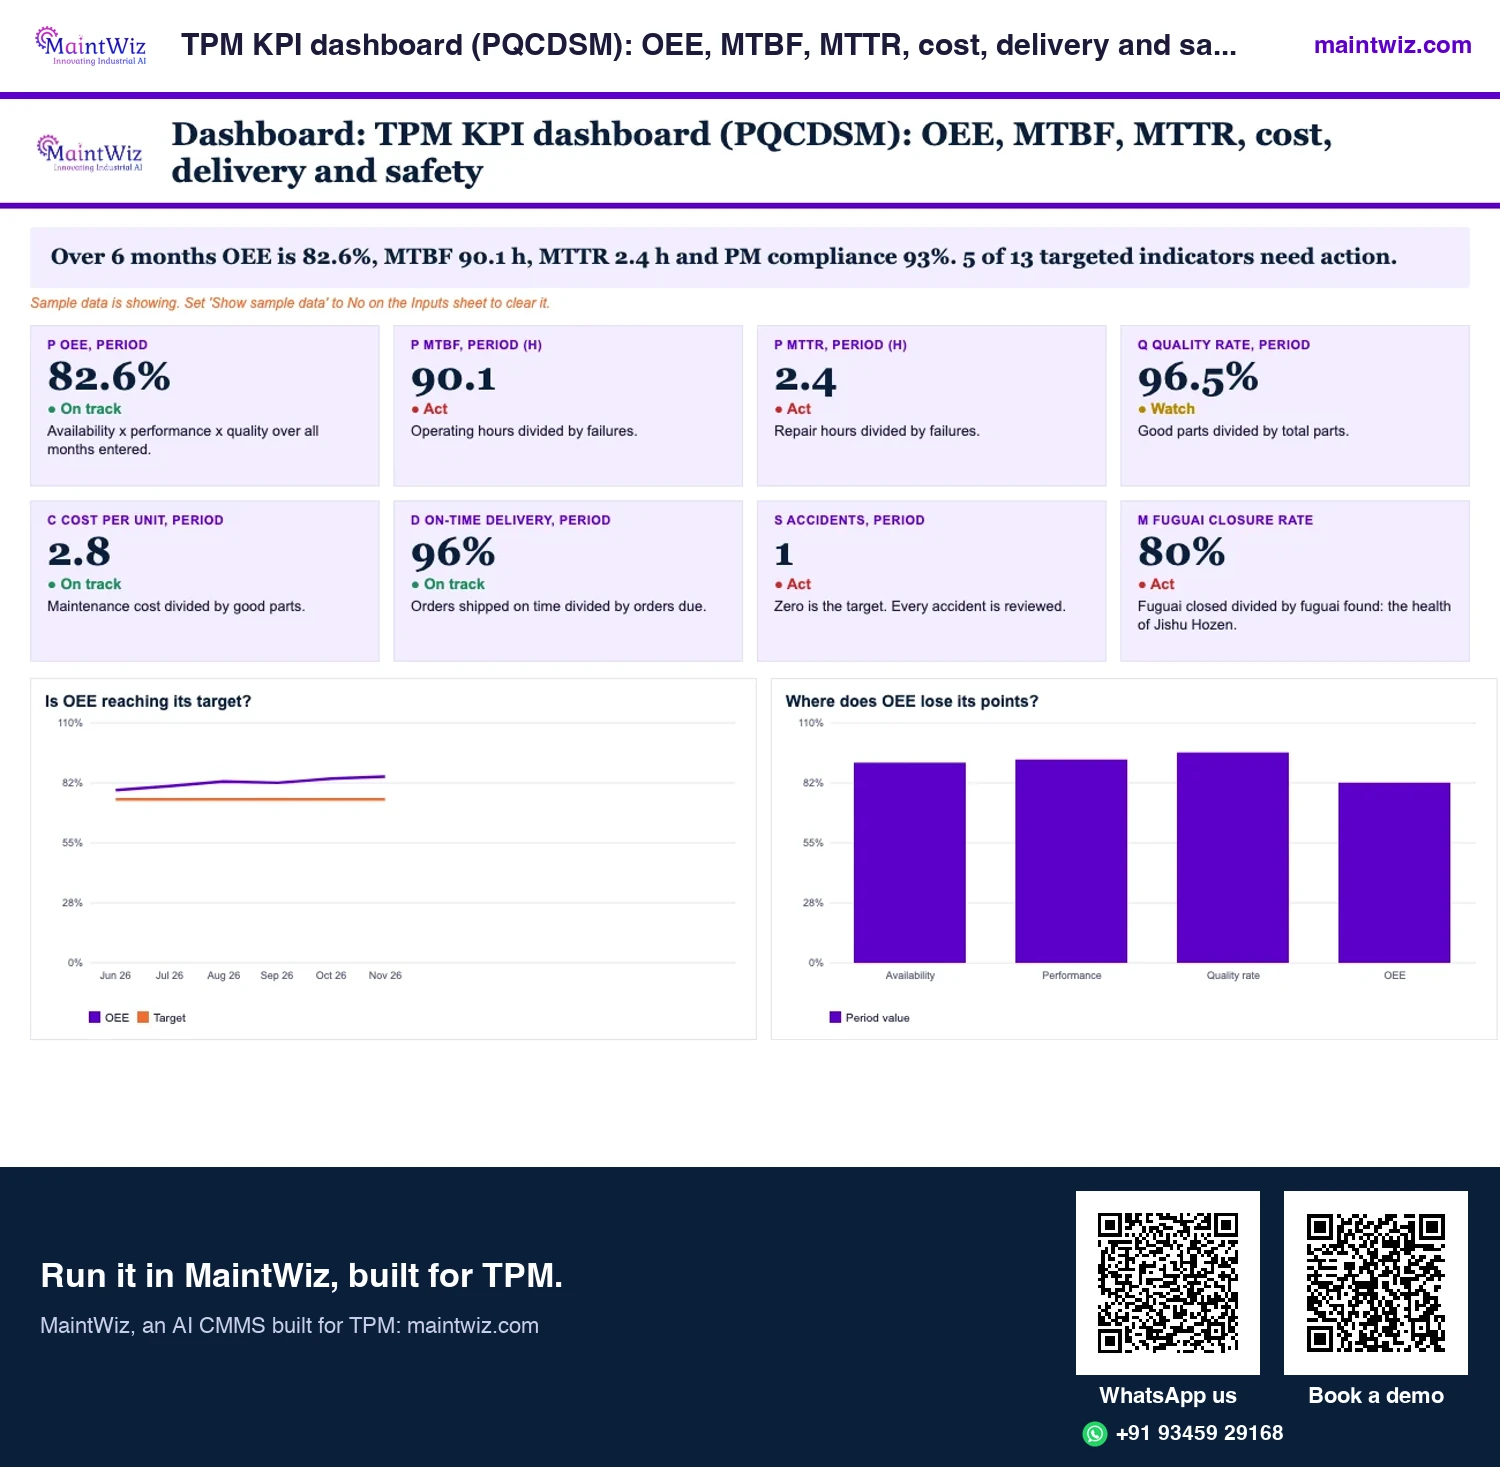
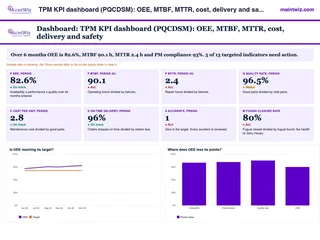 ExcelTPM KPI dashboard (PQCDSM): OEE, MTBF, MTTR, cost, delivery and safety
Track OEE, MTBF, MTTR, cost per unit, on-time delivery, safety and fuguai closure monthly against targets
- Sheets
- Dashboard, Inputs, Data, Targets, Read me
- A4
- Version
- v1.0, 2 November 2026
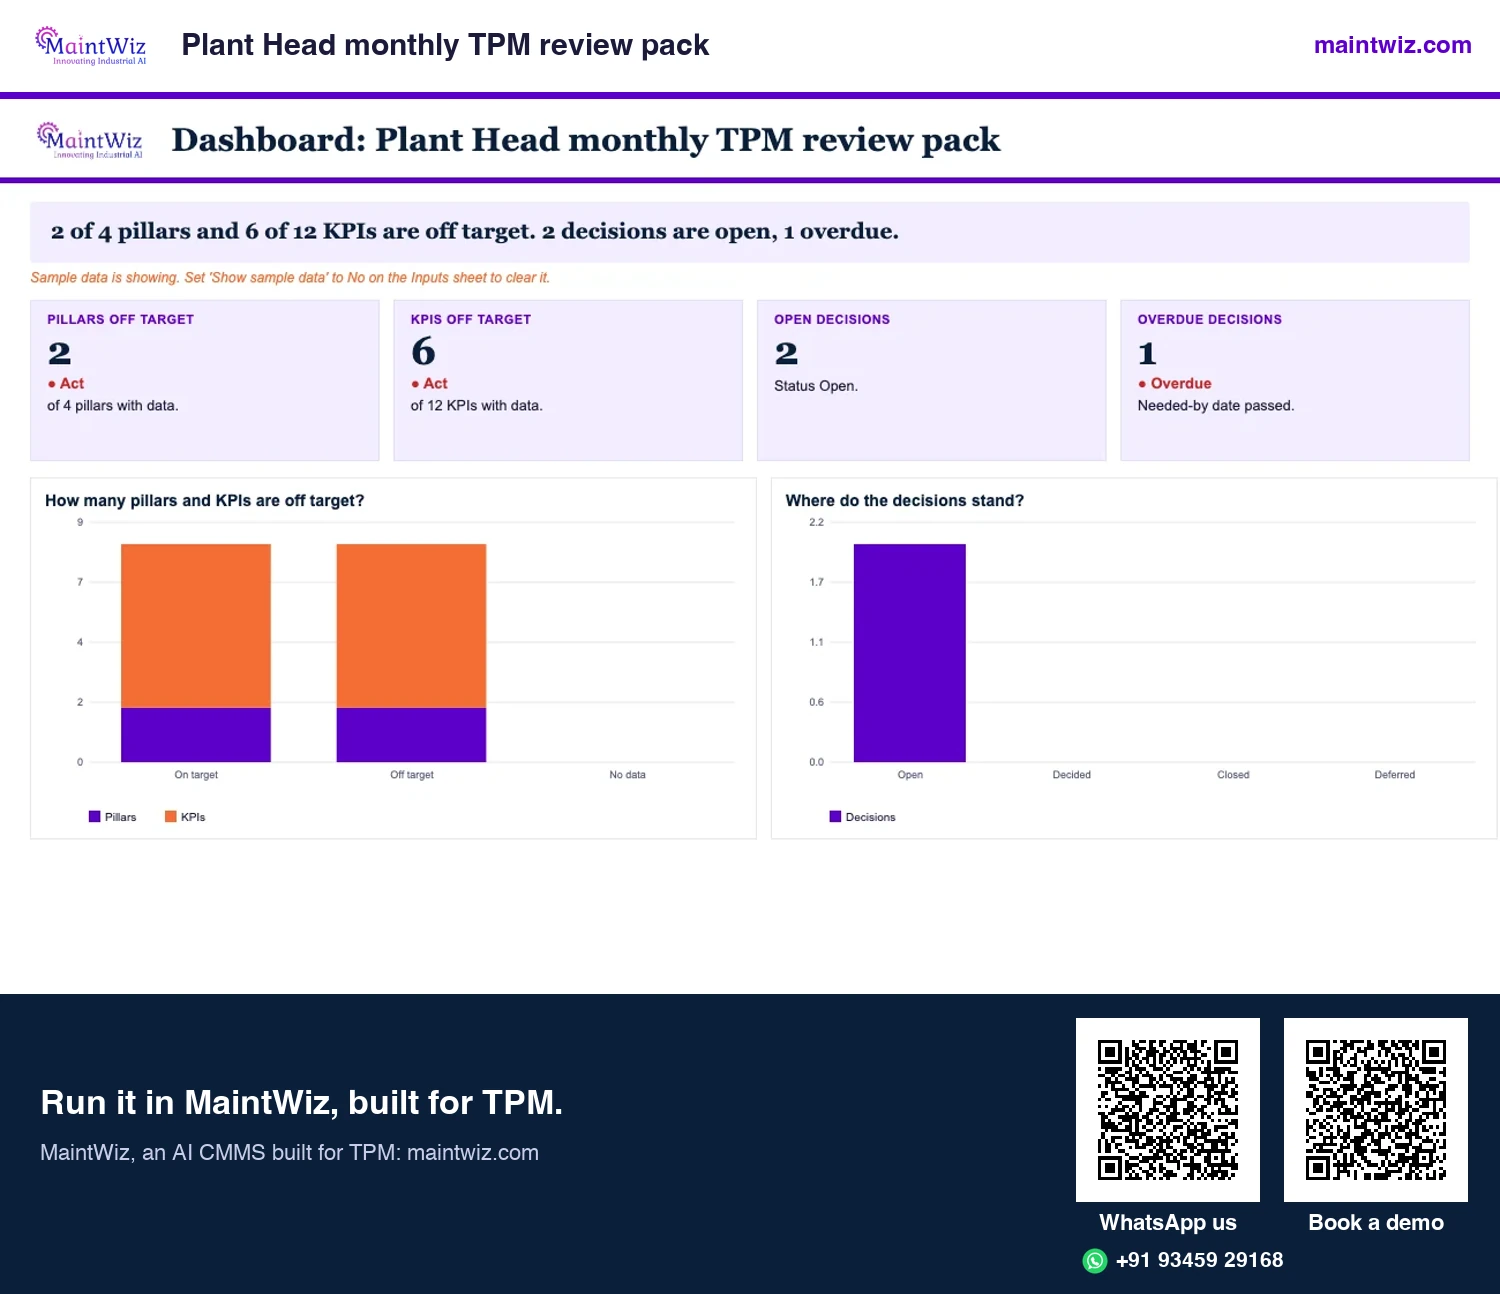
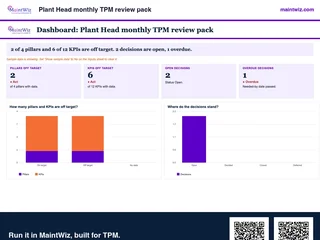 ExcelPlant Head monthly TPM review pack
Run the monthly TPM review on a correct PQCDSM scorecard, with pillar status, decisions and a one-page board extract
- Sheets
- Dashboard, Inputs, Pillar status, KPI scorecard, Decisions, Agenda, Board extract, Read me
- A4
- Version
- v1.1, 4 November 2026
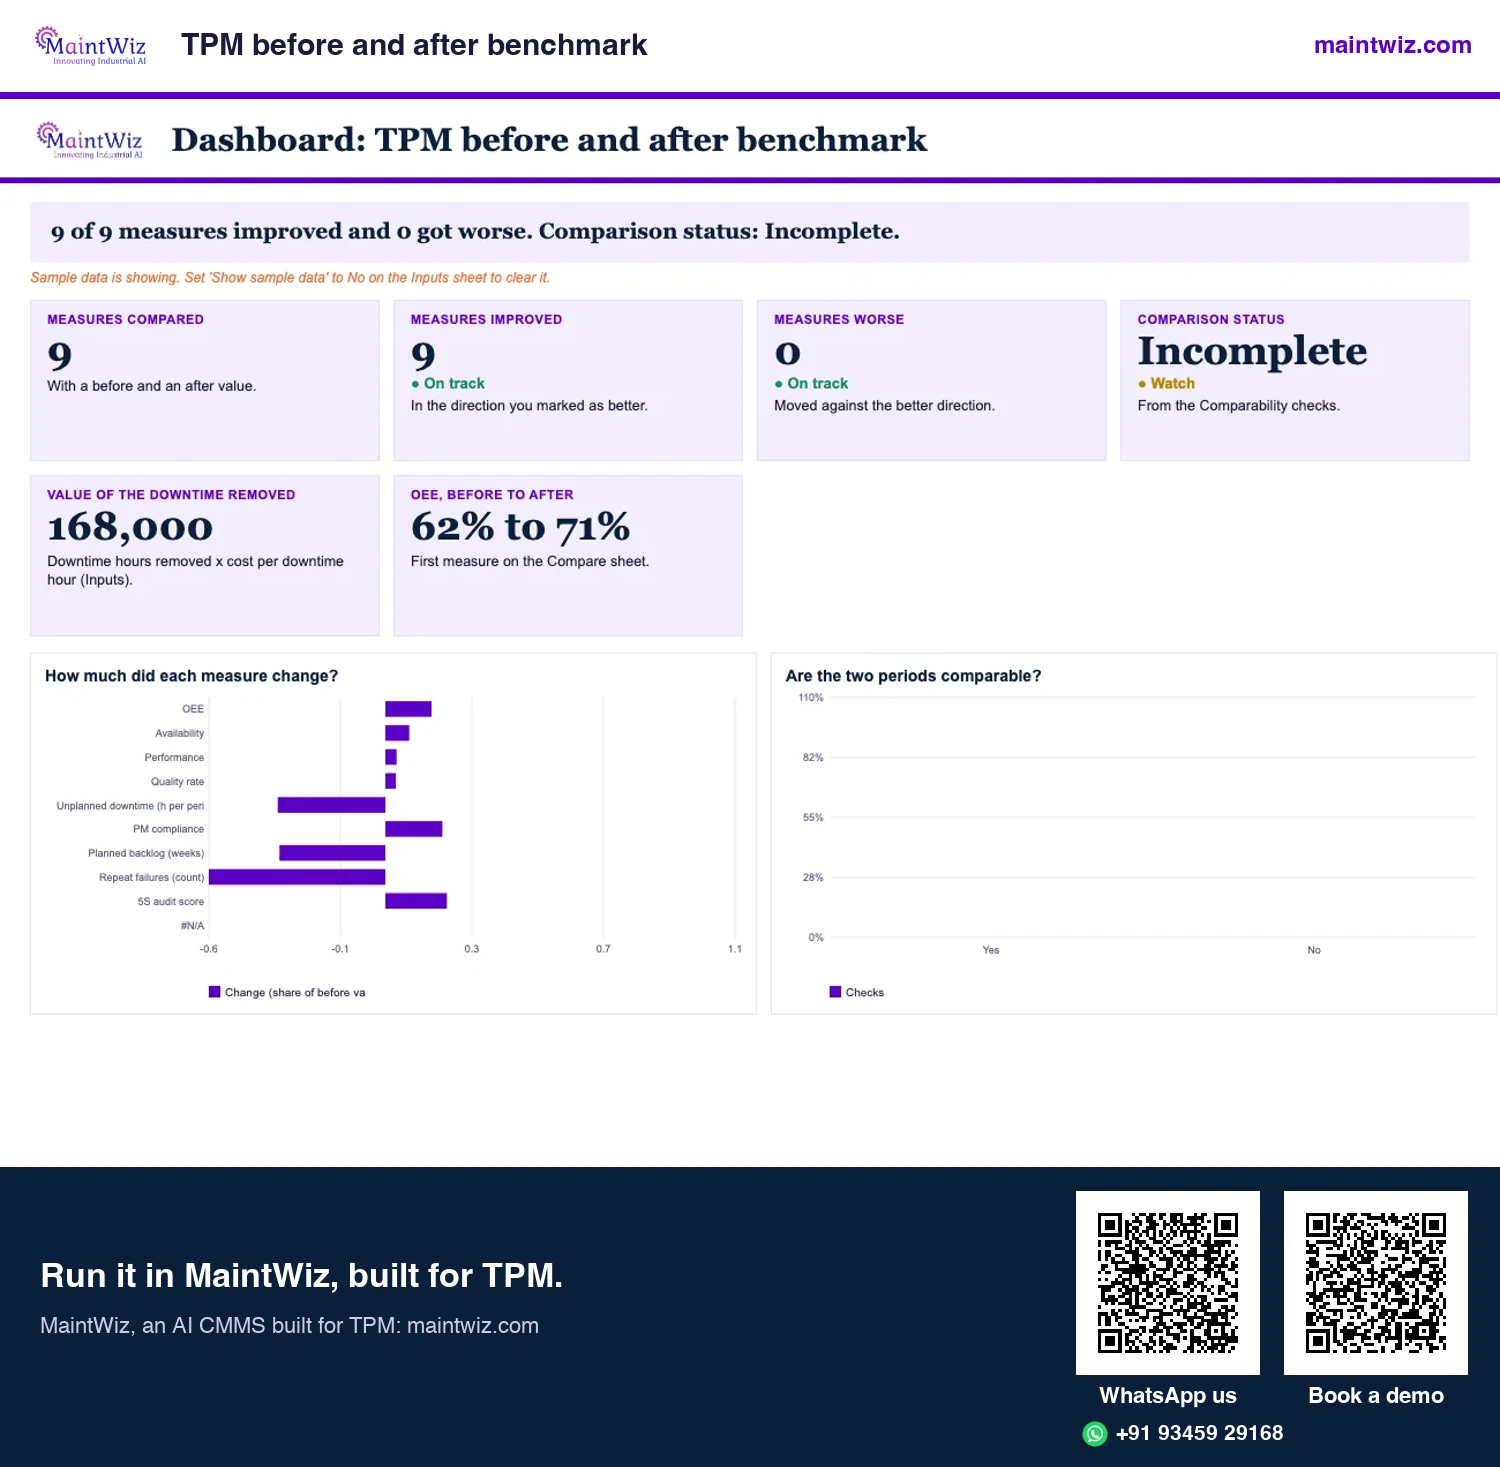
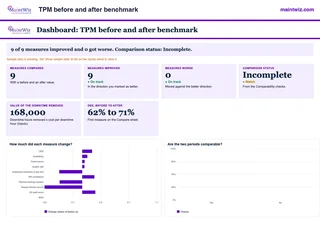 ExcelTPM before and after benchmark
Compare a pilot before and after on the same definitions
- Sheets
- Dashboard, Inputs, Compare, Comparability, Pilot result, Read me
- A4
- Version
- v1.0, 2 November 2026
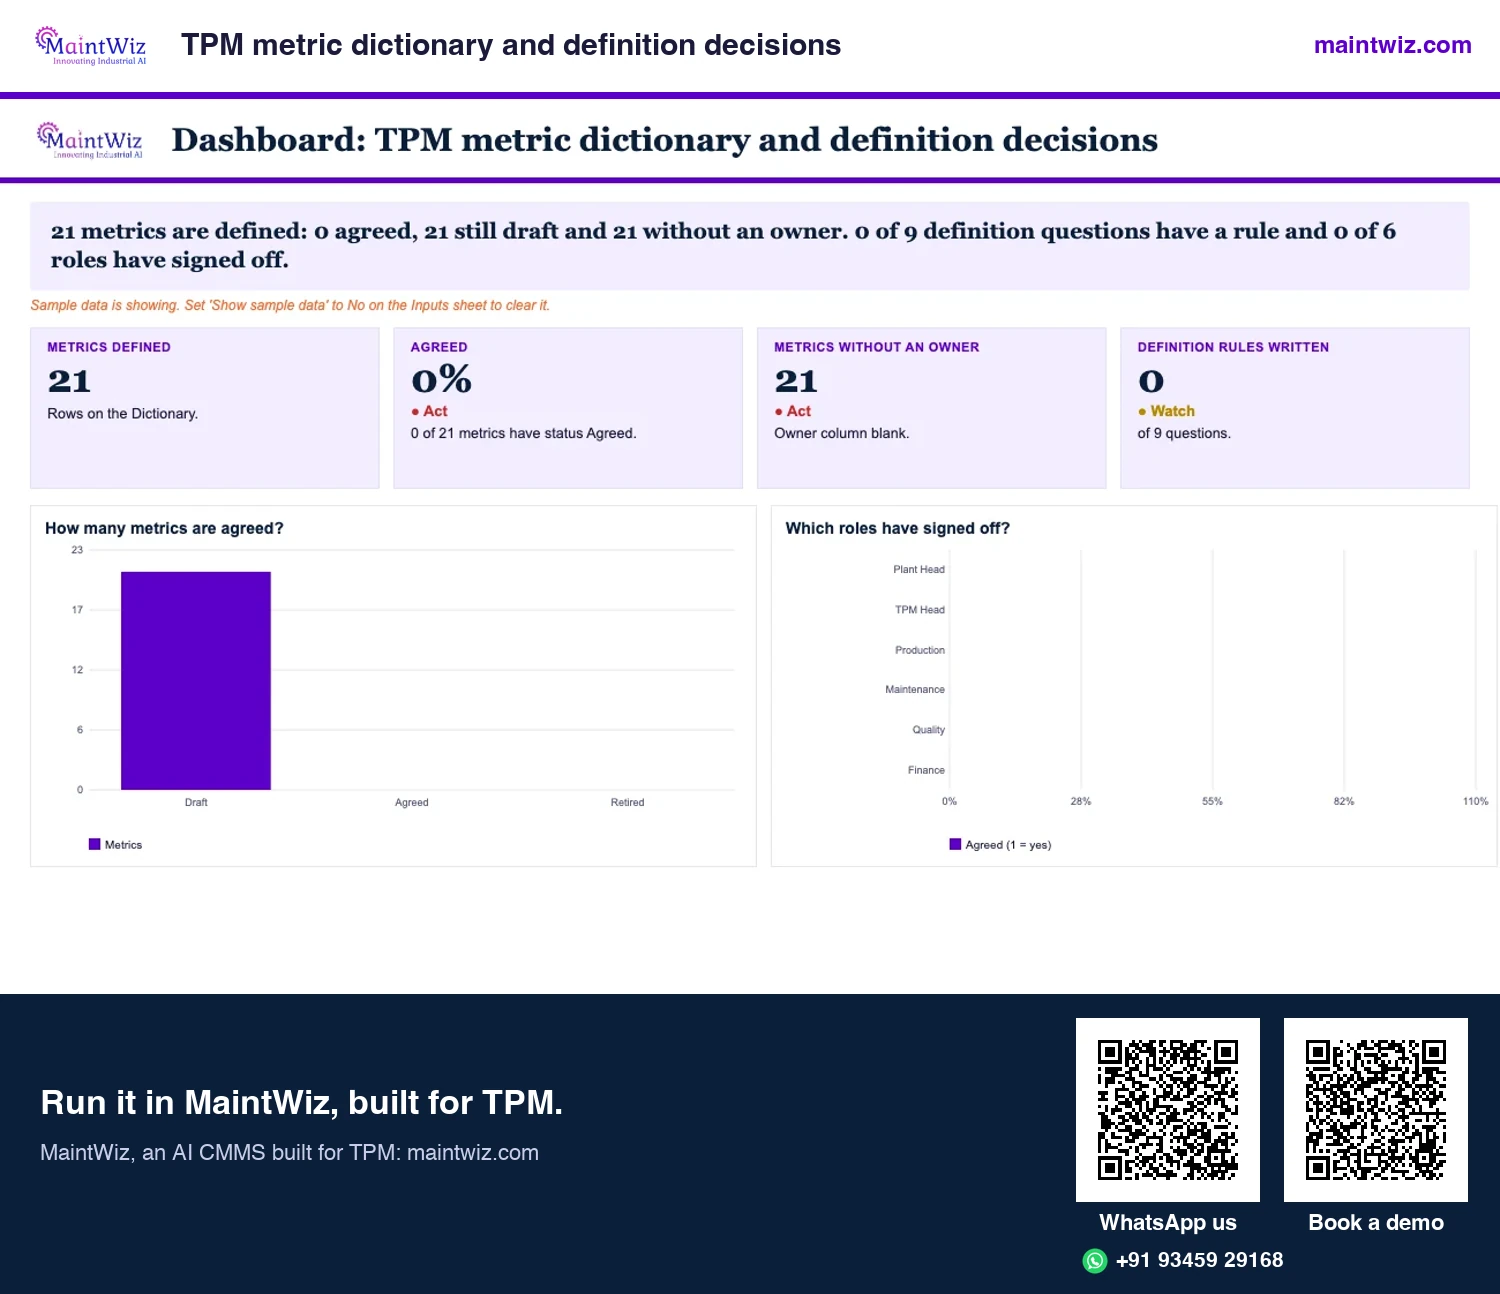
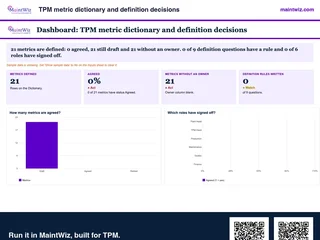 ExcelTPM metric dictionary and definition decisions
Twenty-one TPM metric definitions, including fuguai closure, BM / PM ratio, cost per unit and OTIF
- Sheets
- Dashboard, Inputs, Dictionary, Decisions, Sign-off, Read me
- A4
- Version
- v1.0, 2 November 2026
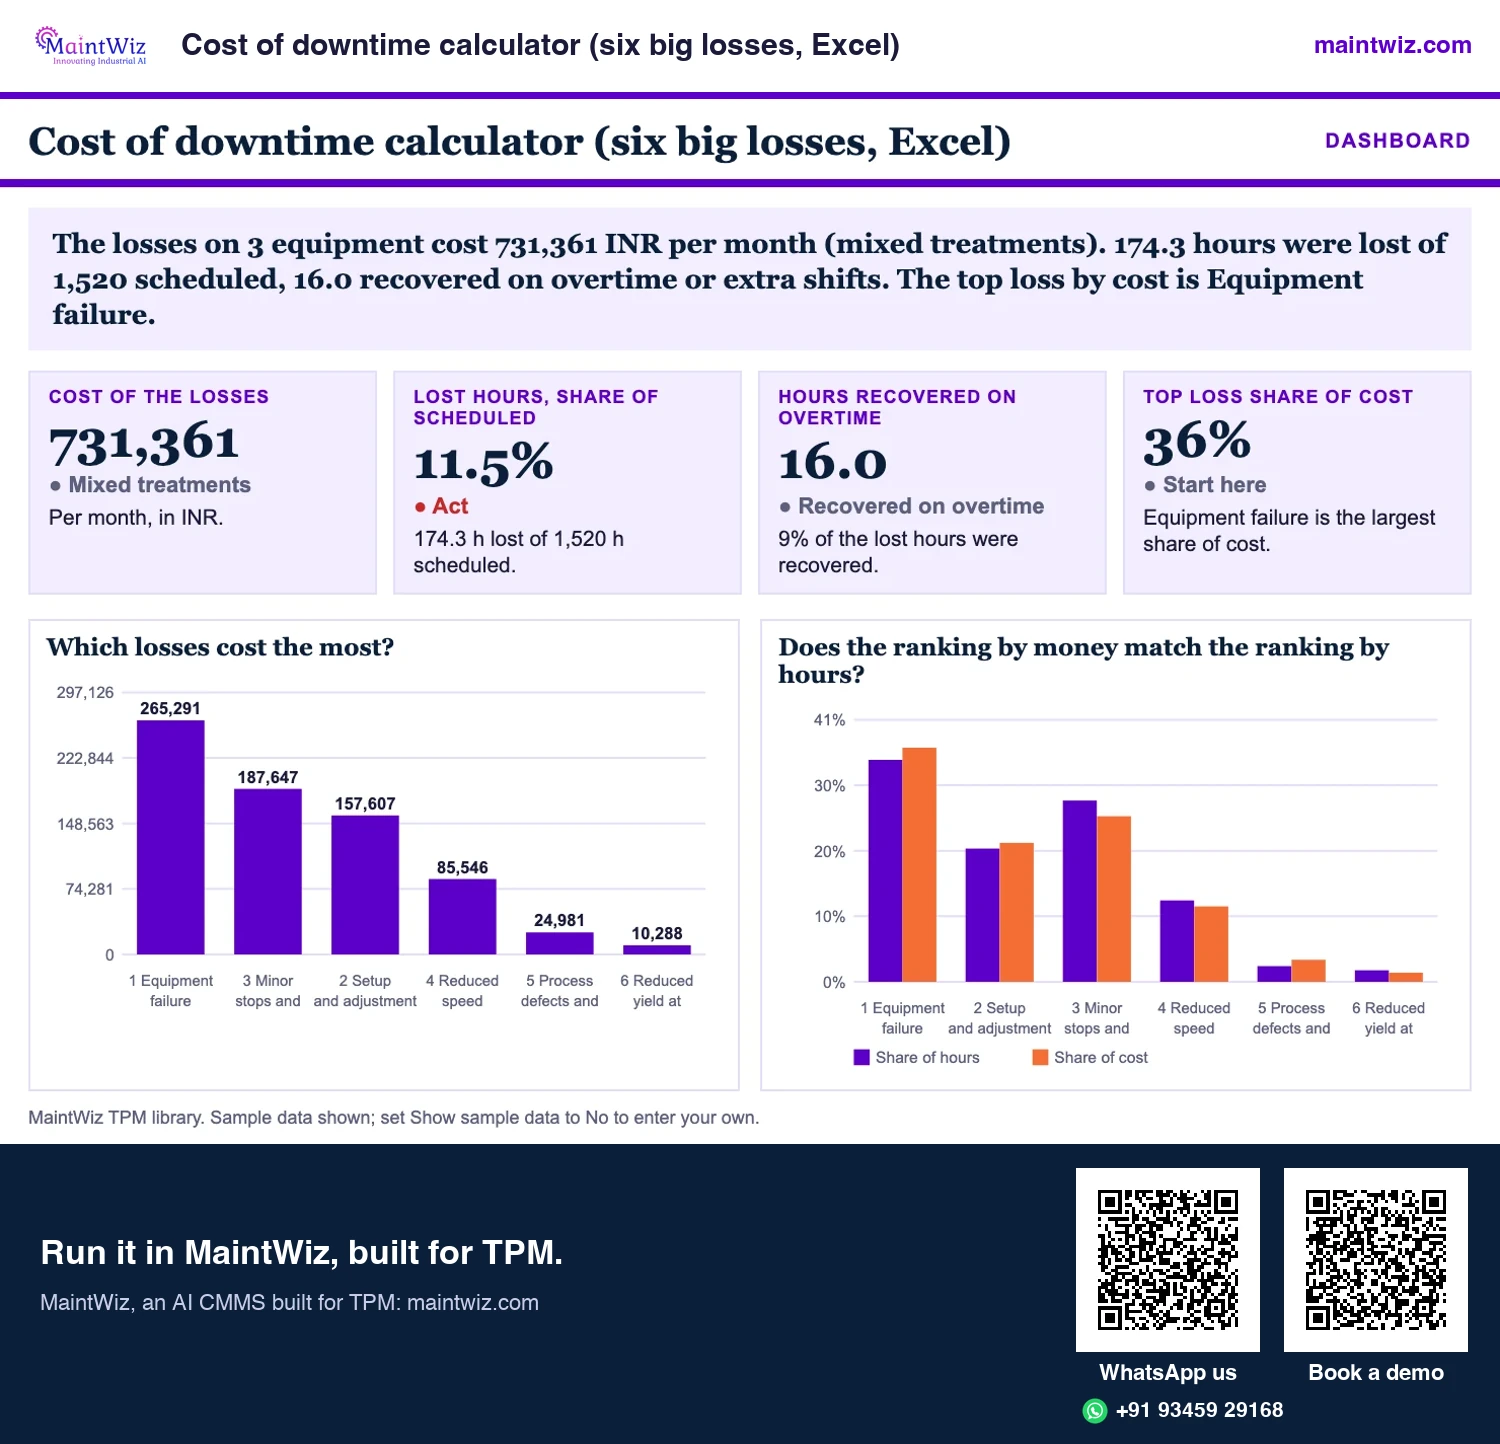
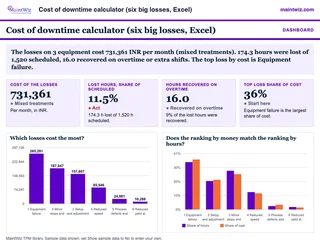 ExcelCost of downtime calculator (six big losses, Excel)
Turn hours lost to each of the six big losses into cost per line, with overtime recovery
- Sheets
- Dashboard, Inputs, Equipment, Results, Read me
- A4
- Version
- v1.2, 5 November 2026
MTBF and MTTR
MTBF and MTTR in a TPM scorecard
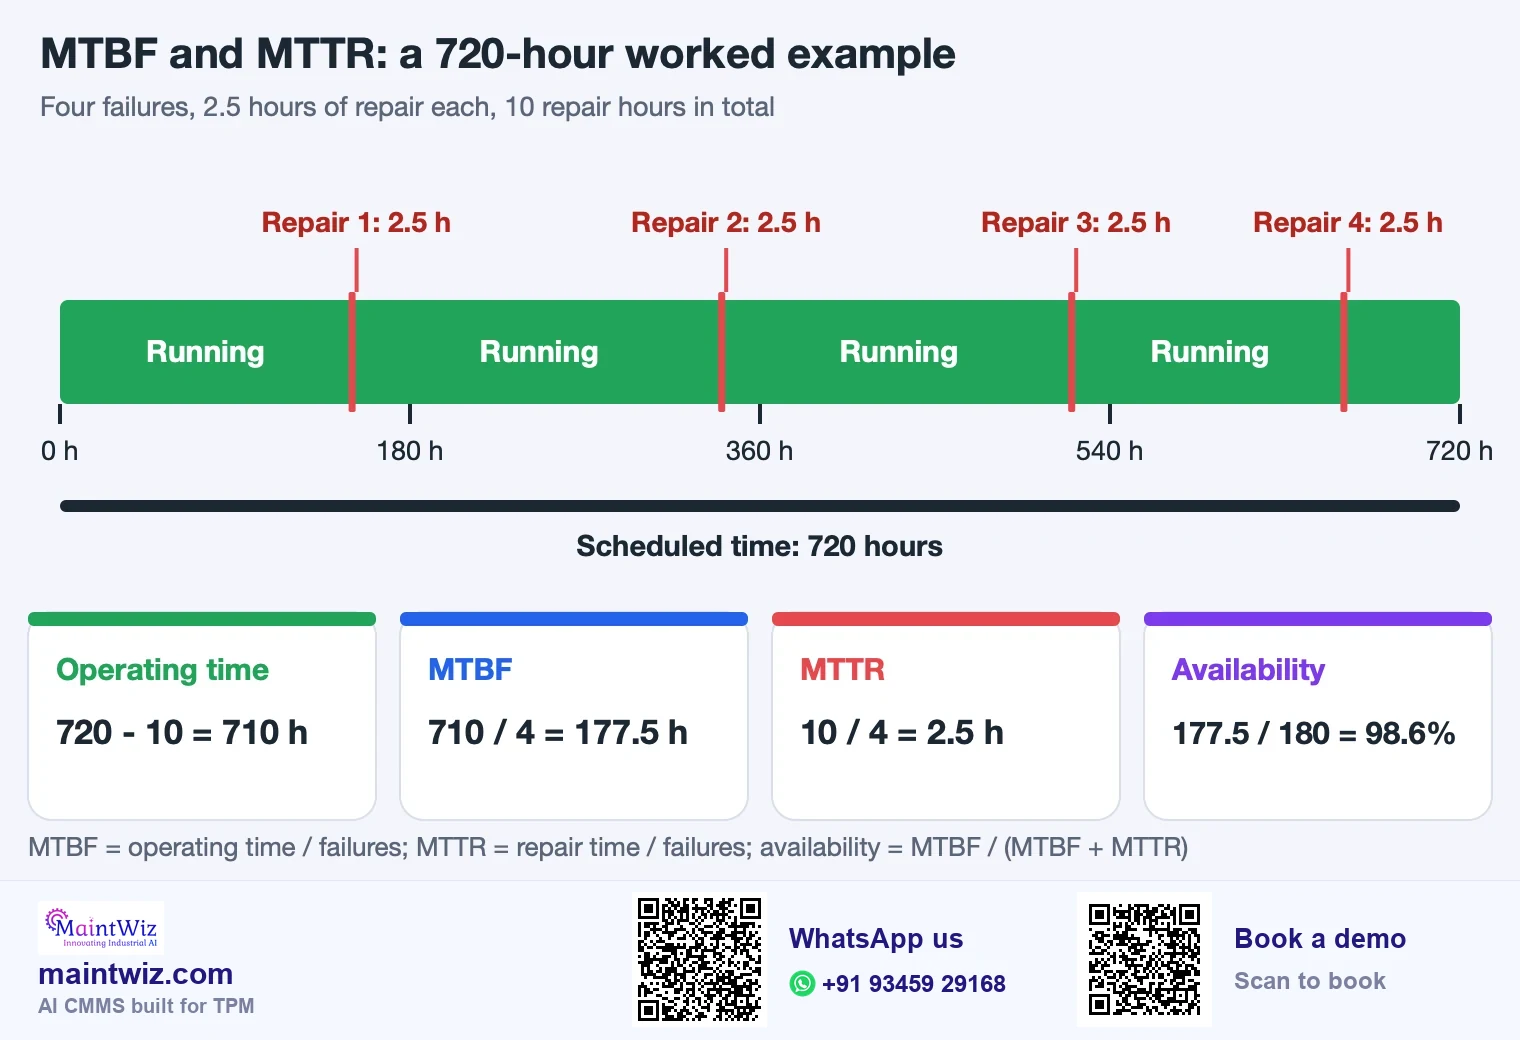
MTBF is operating time divided by failures and MTTR is repair time divided by failures; both rest on one written failure definition. A machine scheduled 720 hours with four failures and 10 repair hours gives MTBF 177.5 h and MTTR 2.5 h (Figure 3), and the MTBF and MTTR calculator works any failure log step by step.
Decisions to write down
Decisions to write down: what counts as a failure (stops over a set length, or any work order of a given type), whether waiting for parts is in repair time, and whether scheduled shutdowns are excluded from operating time.
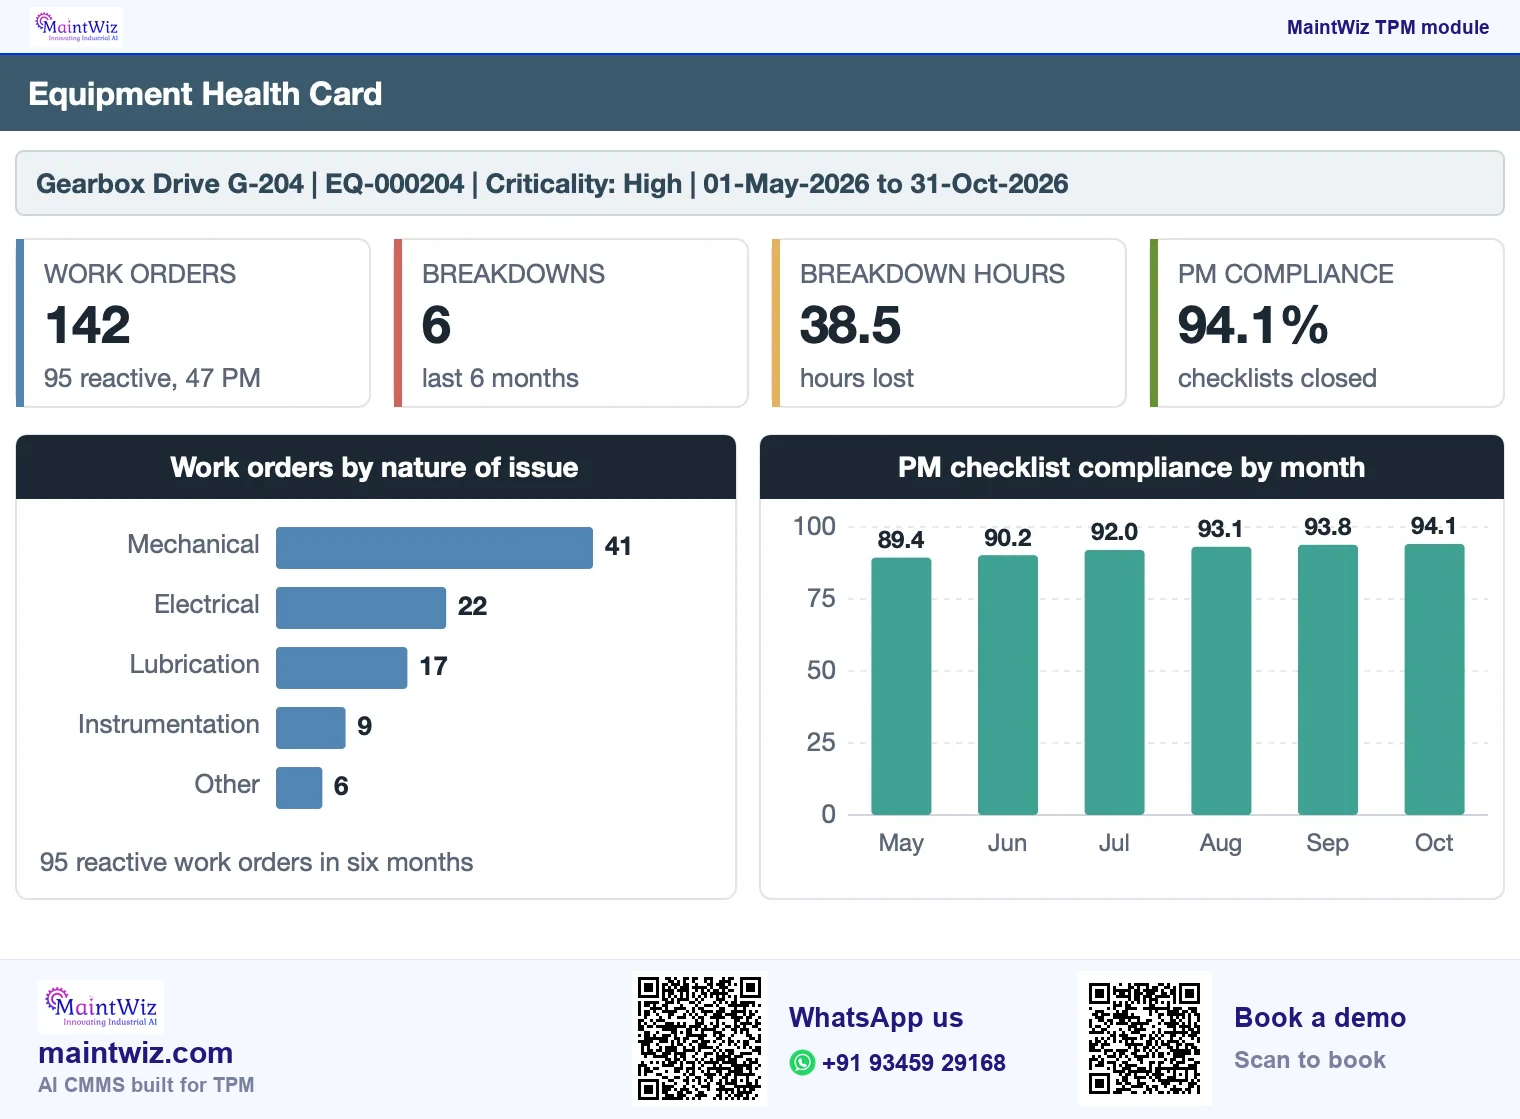
MaintWiz Maintenance KPI Tracking shows breakdown count and hours by month and by day from work orders (Figure 5), and the Equipment Health Card shows each machine's breakdowns beside its PM compliance (Figure 4). Book a demo to see them on your own work orders.
Track the same measures by month in the free TPM KPI dashboard workbook.
Maintenance KPIs
Breakdown frequency, PM compliance and backlog
Breakdown frequency is simple and robust: failures per equipment per month, ranked. PM compliance shows whether the plan is being executed: a plan that exists on paper but is completed late or not at all explains many availability losses. Define 'on time' (within a tolerance of the due date) and what counts as done. Backlog compares open planned work with the capacity to do it; a growing backlog is an early warning of future breakdowns.
The planned to unplanned ratio shows whether maintenance is proactive. Agree work-order classification rules first, so planned maintenance work is counted the same way every month (Figure 4).
PQCDSM
What is PQCDSM?
PQCDSM: six aims, one measure each
Where each measure lives in MaintWiz
- PProductivity
OEE
In MaintWiz: OEE capture
- QQuality
Rejection rate
In MaintWiz: Quality maintenance rejection RCA
- CCost
Maintenance and loss cost
In MaintWiz: Loss cost master
- DDelivery
Schedule adherence
In MaintWiz: Planning
- SSafety
Near misses and incidents
In MaintWiz: Safety, health and environment register
- MMorale
Kaizen suggestions and training hours
In MaintWiz: Kaizen idea sheet; education and training
maintwiz.comAI CMMS built for TPMWhatsApp us+91 93459 29168Book a demoPQCDSM is a scorecard acronym used in TPM and lean programmes: productivity, quality, cost, delivery, safety and morale. It widens the view from equipment to the plant's results. Typical measures: output per hour or OEE for productivity, rejection and complaint rates for quality, maintenance cost and loss cost for cost, on-time delivery for delivery, near misses and incidents for safety, and suggestions, training and attendance for morale.
| Letter | Example measures | Where the data usually lives |
|---|---|---|
| Productivity | OEE, output per labour hour | OEE capture, production records |
| Quality | Rejection rate, repeat defects, complaints | Quality records |
| Cost | Maintenance cost, loss cost, spare parts | CMMS, finance |
| Delivery | On-time delivery, schedule adherence | Planning, ERP |
| Safety | Near misses, incidents, observations | Safety register |
| Morale | Suggestions, training hours, attendance | HR, idea log, training records |
Pick one measure per letter and keep its definition fixed for the year (Figure 6).
Each machine's card in MaintWiz Asset Management shows its work orders, breakdowns and PM compliance together.
Leading and lagging
Leading and lagging measures
OEE, MTBF and rejection rate are lagging: they show what already happened. Tags closed on time, step audits passed, PM compliance and training delivered are leading: they show whether the work that should change results is happening. A programme that reports only lagging measures cannot tell a stalled programme from a slow one. Pair each result with the routine that drives it.
Where does BSI PAS 1918 fit?
BSI PAS 1918:2022 is a guide on implementing key performance indicators for Total Productive Maintenance. Write each KPI once with its definition, owner and data source, and keep it fixed between periods.
The metric dictionary gives a place to record each definition, owner and data source, with a sign-off column.
Data collection
How do you collect the data?
- OEE inputs: stops with reason codes and counts, from operators or machines; see OEE software.
- MTBF, MTTR, PM compliance and backlog: from work orders; this needs work orders to record failure start and end, cause and completion.
- Tag and audit measures: from the abnormality register and audit sheets.
- Training and safety measures: from training and incident registers.
- One owner per metric, one definition, one place for the data.
Stop reasons for OEE and MTBF are only comparable if coded consistently; the downtime reason-code library lists codes mapped to the six big losses.
How to build a TPM scorecard that gets used
- Choose five to eight measures at plant level and three to five per pillar: more will not be read.
- Show each with its definition, trend and target, and the owner's name.
- Review weekly at line level, monthly at plant level, quarterly at group level.
- Show OEE with its three factors and a loss Pareto, not OEE alone.
- Retire a measure that no one acts on.
Traps
KPI definition traps
| Metric | Trap | What to write down |
|---|---|---|
| MTBF | Counting planned shutdowns as operating time, or counting minor stops as failures | What counts as a failure and as operating time |
| MTTR | Including waiting for parts or people in some jobs and not others | Where repair time starts and ends |
| PM compliance | Counting a task done late as on time | The tolerance around the due date |
| Backlog | Mixing planned and corrective work | Which work types are in scope and in what unit |
| OEE | Changing the planned time rule between periods | The planned time, minimum stop and rework rules |
| Tags closed on time | Resetting the target date when a tag is late | That the original target date stays |
| Audit score | Different auditors scoring differently | Who audits and the scoring guide |
Who reads which KPI, and how often?
| Audience | Reads | Cadence |
|---|---|---|
| Operators and supervisors | Shift OEE with loss list, open tags, routine completion | Daily |
| Line owners and pillar owners | Loss Pareto, PM compliance, tag ageing, audit scores | Weekly |
| Plant head | OEE trend with factors, breakdown frequency, tags overdue, safety reports | Monthly |
| Group or business excellence | Roll-up on one definition, maturity scores | Quarterly |
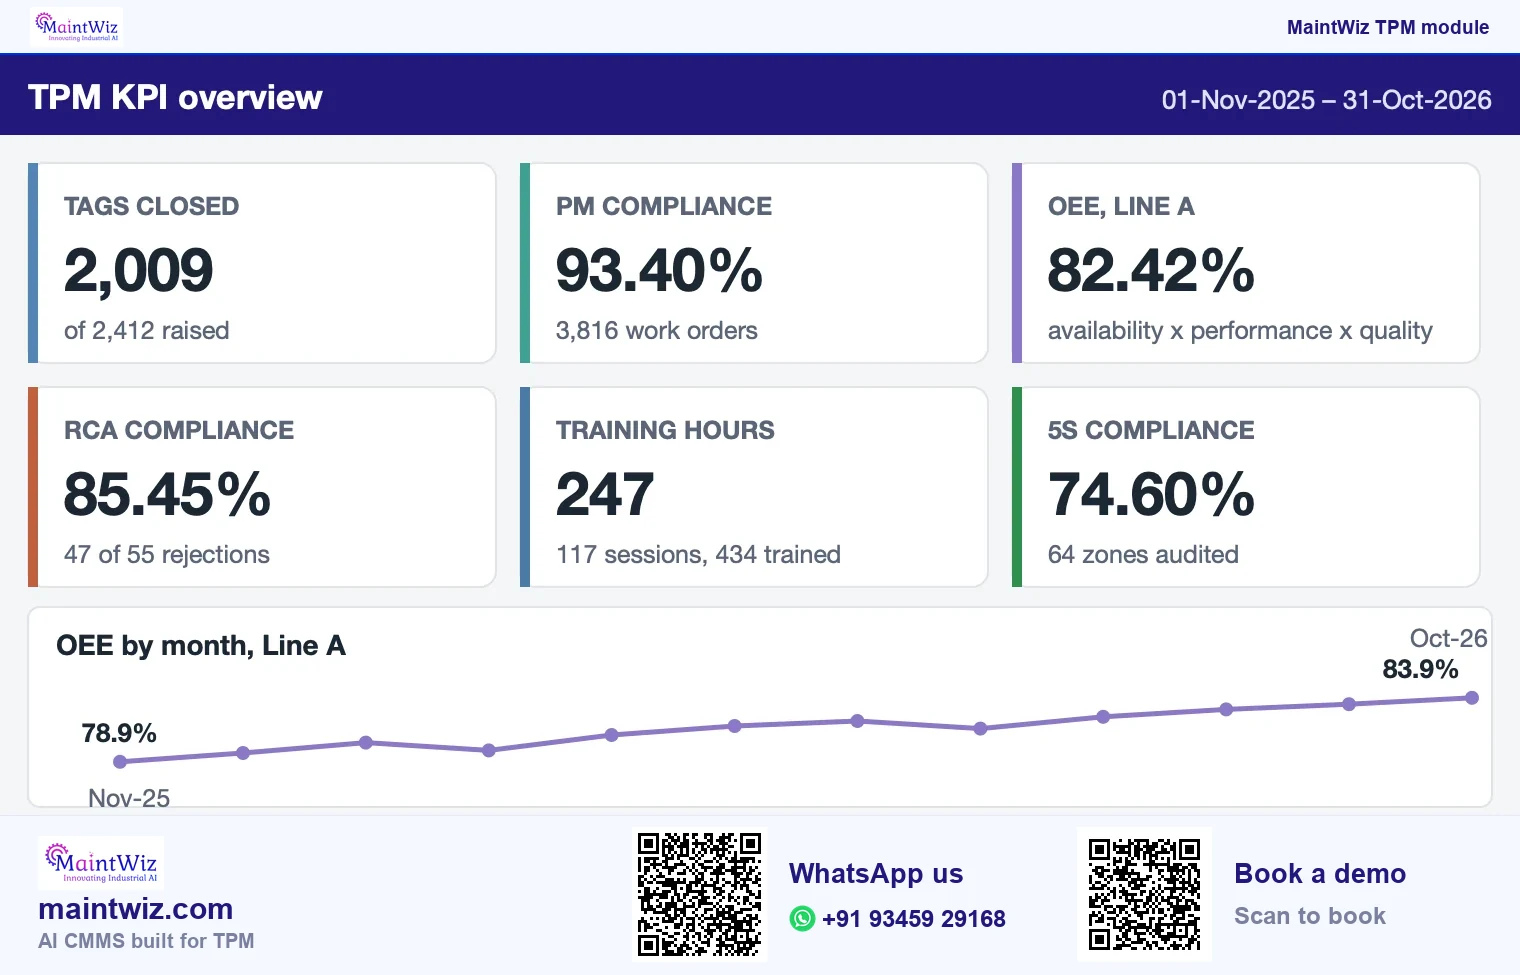
The plant head review pack and KPI dashboard lay these out in a spreadsheet; for OEE, what OEE software is comes down to one definition held for every equipment and shift, so the KPI stays comparable month to month. MaintWiz, an AI CMMS built for TPM, produces the same views from the records: a dashboard for each of the eight pillars and OEE software by equipment, line and plant.
How to set targets for TPM KPIs
Set targets from your own baseline, measured on a fixed definition for several weeks, and from the projects you plan. Set leading targets (tags closed within the agreed time, audits passed by the plan date) alongside result targets. Review targets when the product mix or equipment changes, and write down the date the definition was last changed.
A worked OEE example
A line is planned for 480 minutes and loses 48 minutes to stops. It runs 432 minutes at an ideal rate of 1 piece per minute, makes 410 pieces and 402 are good.
| Factor | Calculation | Result |
|---|---|---|
| Availability | (480 - 48) / 480 | 90.0% |
| Performance | 410 / (432 x 1) | 94.9% |
| Quality | 402 / 410 | 98.0% |
| OEE | 90.0% x 94.9% x 98.0% | 83.8% |
That result sits close to the often-quoted 85% figure, which is built from 90% availability, 95% performance and 99% quality. Use the OEE calculator on your own numbers, and read what a good OEE score is before you set a target.
MTBF, MTTF, MTTR
MTBF vs MTTF vs MTTR: which to use
The three abbreviations are often confused because they differ by one letter or by the type of equipment. The deciding question is whether the item is repaired and returned to service or is replaced when it fails. MTBF is the average operating time between failures of an item that is repaired and put back to work. MTTF is the average operating time until an item fails when it is replaced rather than repaired. MTTR is the average time to restore a failed item: total corrective maintenance time divided by the number of corrective actions. Treat parts lead time the same way in every job, in repair time for all or for none.
| Measure | Item type | What it averages | Common mistake |
|---|---|---|---|
| MTBF | Repairable: pumps, motors, conveyors, machines | Operating time between failures | Counting scheduled stops or waiting time as operating time |
| MTTF | Non-repairable or replaced on failure: bulbs, some bearings and sensors | Operating time until the first failure | Using it for equipment that is repaired and put back |
| MTTR | Repairable items | Time to repair a failure | Including parts lead time in some jobs and not others |
A worked structure
For a repairable machine, MTBF and MTTR come from operating time, the failure count and total repair time, as in Figure 3. For a bearing replaced at each failure, with life spans of 4,000, 5,200 and 4,800 hours in service, MTTF is the average of the three, 4,666.7 hours. The bearing's replacement time is not part of MTTF; it belongs to the maintenance of the machine that holds it.
Report MTBF and MTTR for each equipment, not as a plant average: a plant figure hides the one machine that fails every week. Rank equipment by failures and by repair hours, and start improvement projects at the top of both lists.
What to write down
- Whether each item is repairable or replaced, so the right measure is used.
- What counts as a failure: any work order of a given type, or stops longer than a set length.
- Where repair time starts and ends, and whether waiting for parts is in it.
- Whether scheduled shutdowns are excluded from operating time.
The MTBF and MTTR calculator applies the repairable-item formulas, and the downtime reason codes page shows how to classify stops so the failure count is consistent.
FAQ
Frequently asked questions
What are the KPIs of TPM?
Common ones are OEE, MTBF, MTTR, breakdown frequency, PM compliance and backlog, tags closed on time, audit scores, rejection rate, training hours and near misses closed, grouped by pillar.
What does PQCDSM stand for?
Productivity, quality, cost, delivery, safety and morale. It is a scorecard acronym used in TPM and lean programmes to cover results beyond the equipment; each letter carries one measure, such as OEE for productivity and near misses closed for safety.
How do you measure PM compliance?
Divide planned tasks completed on time by planned tasks due in the period. Define the tolerance for on time and what counts as completed, and report it with the backlog.
Which TPM KPIs are leading indicators?
Tags closed on time, step audits passed, PM compliance and training delivered show whether the routines are happening. OEE, MTBF and rejection rate are lagging results.
How does MaintWiz report TPM KPIs?
MaintWiz, an AI CMMS built for TPM, holds the records behind each KPI on a dashboard per pillar: tag records by colour and closure for Jishu Hozen, PM checklist compliance, OEE by equipment, line and plant, rejection RCA compliance, training sessions and hours, and 5S compliance. Data exports to XLS and PDF.
Which TPM KPIs should a plant head review monthly?
One per line of the PQCDSM scorecard: OEE for productivity, rejection rate for quality, loss cost per hour for cost, schedule adherence for delivery, near misses closed for safety and Kaizen ideas implemented for morale. Add tag closure and PM compliance as the routines behind them, and keep every definition fixed for the year.
Sources
Sources
- BSI PAS 1918:2022, Total Productive Maintenance: implementing key performance indicators, guide (catalogue entry). https://knowledge.bsigroup.com/products/total-productive-maintenance-tpm-implementing-key-performance-indicators-guide
- ISO 22400-2:2014, Automation systems and integration: Key performance indicators (KPIs) for manufacturing operations management, Part 2: Definitions and descriptions https://www.iso.org/standard/54497.html