
Key takeaways
- OEE software turns four inputs, planned time, stops with reasons, total and good counts and the ideal cycle time, into availability, performance, quality and a ranked list of losses.
- There are four types: operator entry on a tablet or terminal, sensor or machine-signal capture, MES-based and CMMS-based. They differ in how data gets in and in what happens after a loss is found.
- Sensors are optional: operator entry gives a working OEE from the first shift, and machine signals can be added line by line.
- MaintWiz holds OEE beside work orders and all eight pillars, plus 5S, Kaizen and one point lessons, with mobile capture, IoT-created work orders and a roll-out of the whole TPM in 6 to 8 weeks.
OEE software
What is OEE software?
OEE software is a system that captures planned production time, every stop with its reason, total and good counts and the ideal cycle time for each equipment, then calculates availability, performance, quality and OEE and ranks the losses behind the gap. It shows plant teams which loss to remove first, shift by shift. It is also called OEE monitoring, OEE tracking or production monitoring software.
The terms in use describe the same job from different sides. An OEE system is the software plus its definitions, reason codes and routines. OEE tracking means recording the inputs every shift so each figure traces back to its stops and counts; OEE monitoring means reading the result by equipment, shift and day; OEE downtime tracking logs each stop with its equipment, duration and reason.
In MaintWiz, OEE is a module of the CMMS: it shows OEE by equipment, line and plant with loss stratification, daily OEE and a lost-hours Pareto, on the same equipment list as work orders and the eight TPM pillars.
Downloads
OEE software starter files
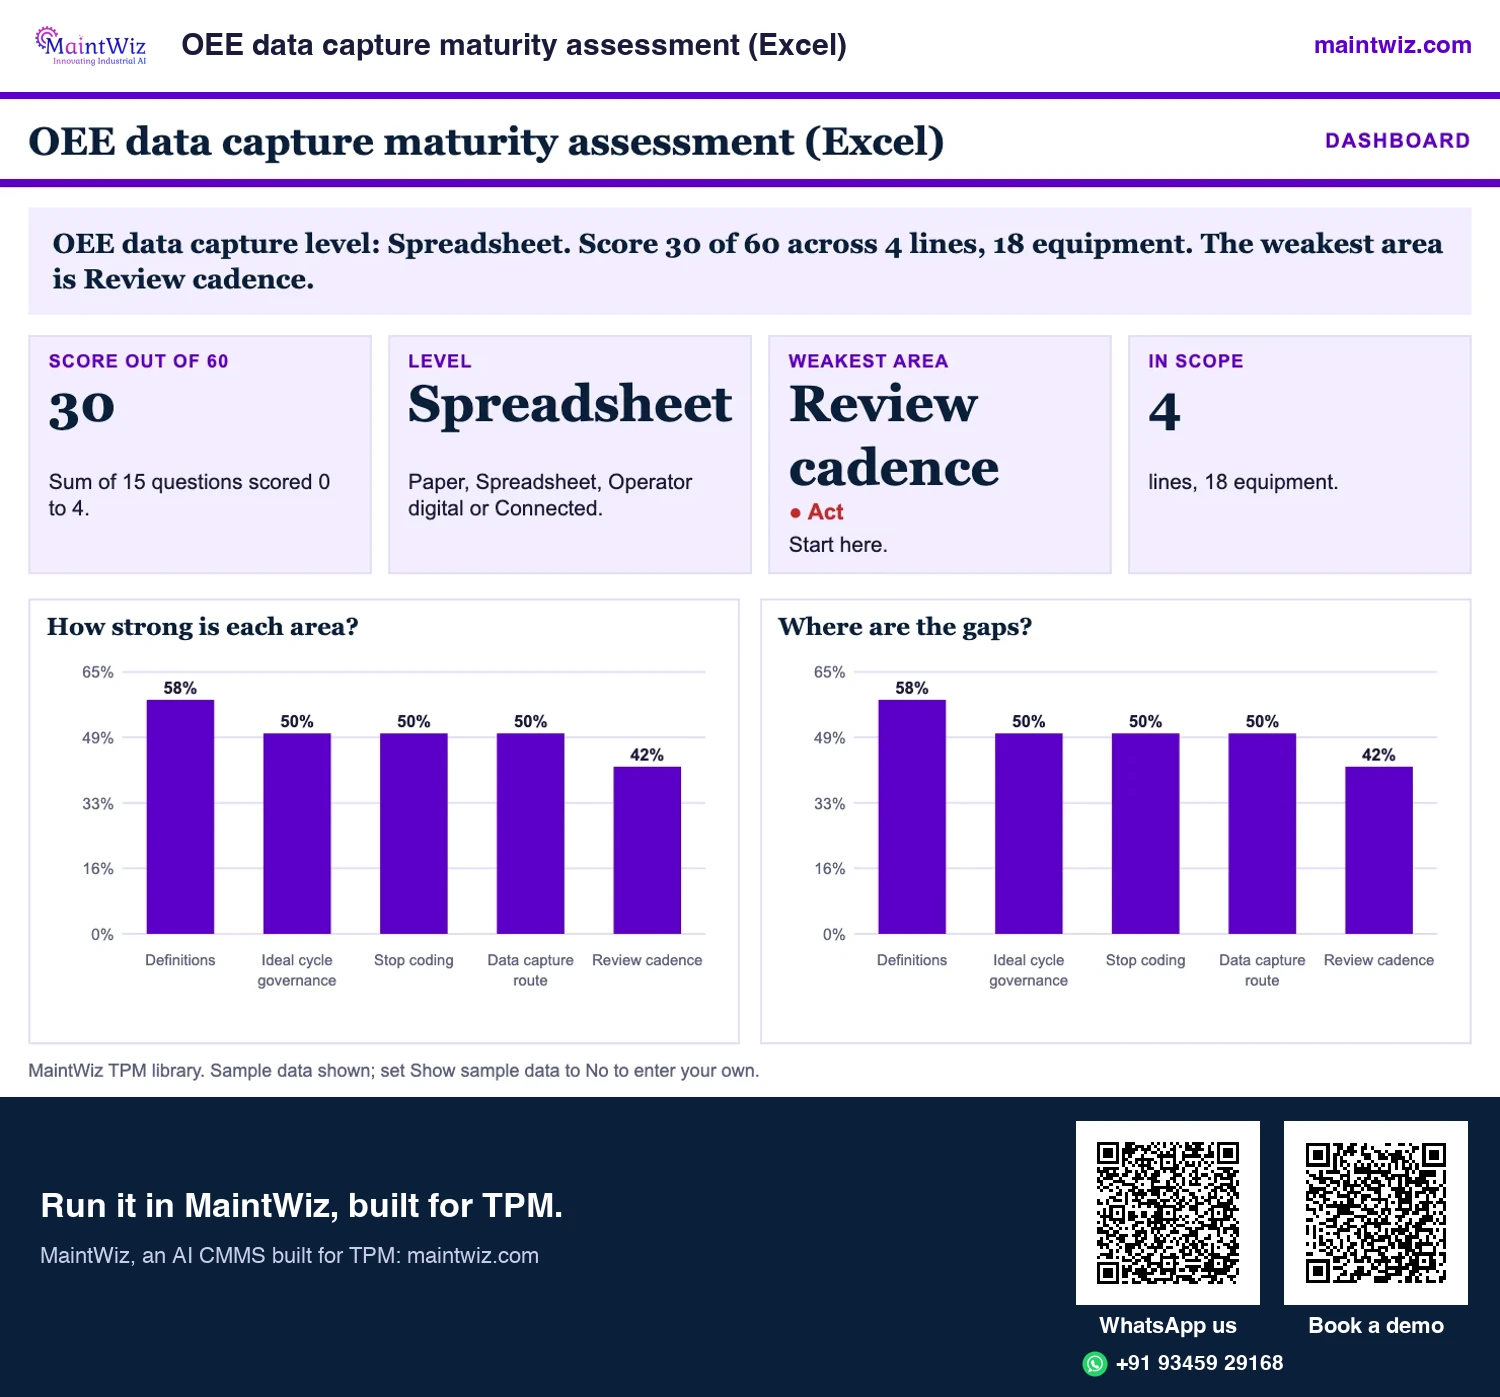
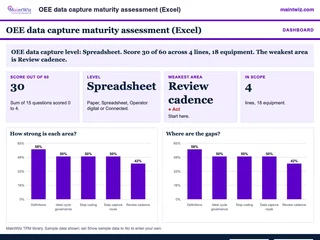 ExcelOEE data capture maturity assessment (Excel)
Score OEE data capture on your lines in 15 questions and get your level, from Paper to Connected, with three steps to the next.
Inside: 15 questions in five areas, scored 0 to 4, out of 60 · Levels: Paper, Spreadsheet, Operator digital and Connected · Weakest area and the three steps to the next level · Lines and equipment in scope
- Sheets
- Dashboard, Inputs, Questions, Results, Read me
- A4
- Version
- v1.0, 5 November 2026
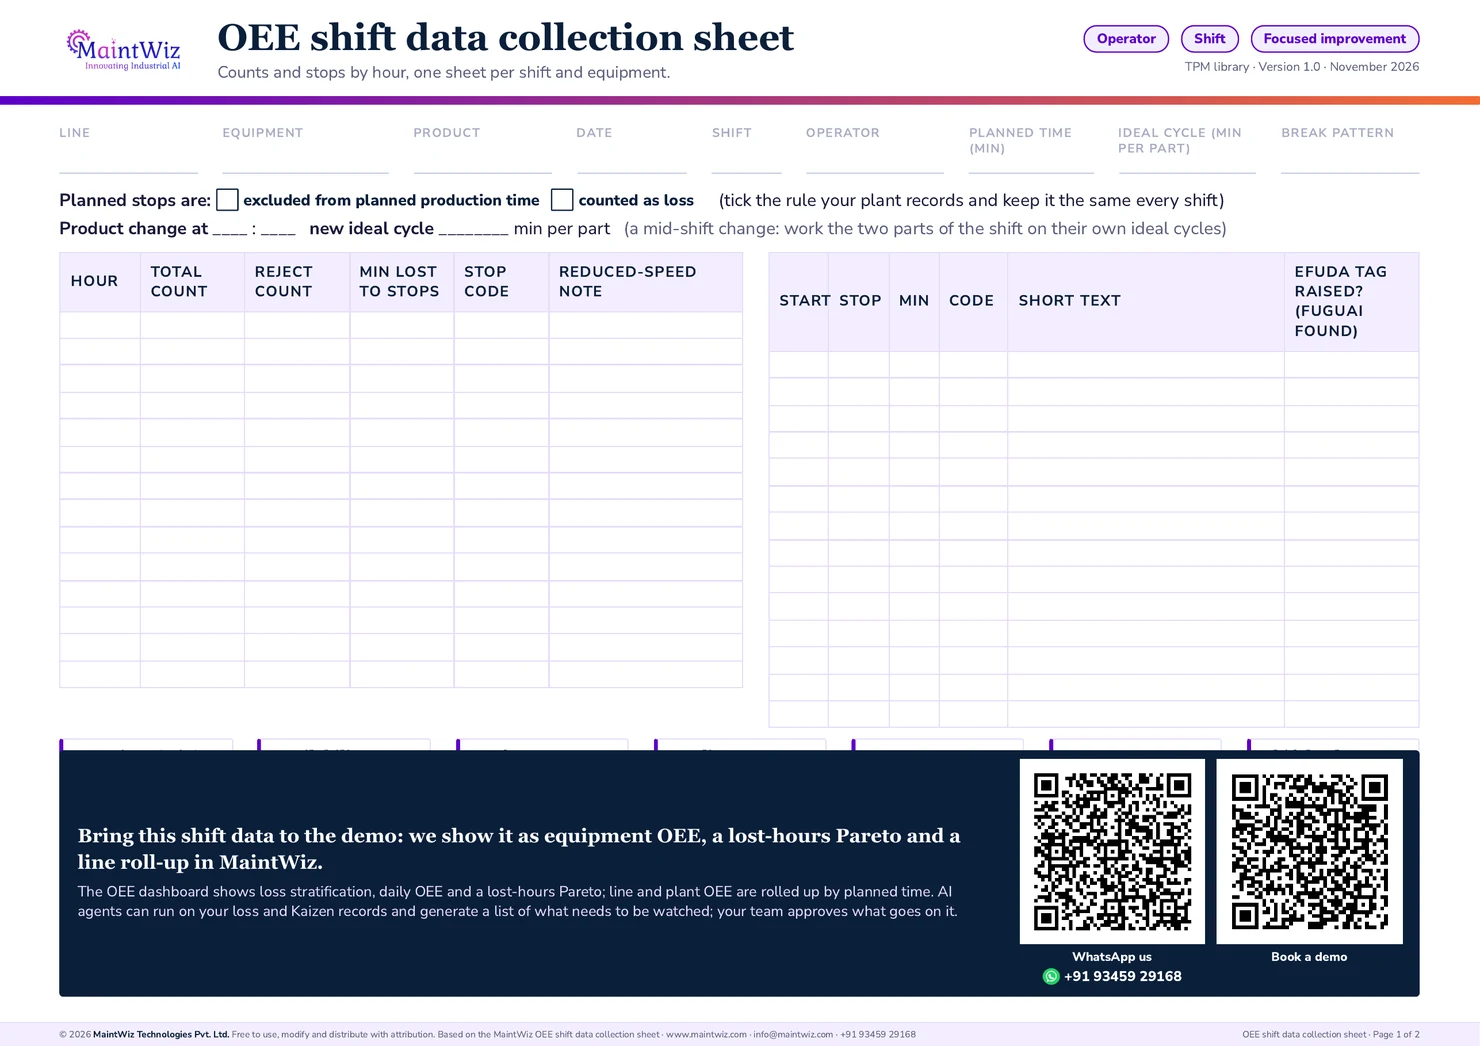
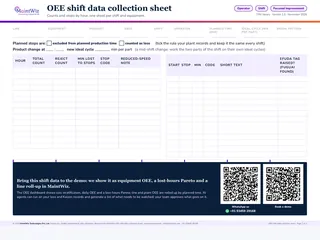 PDFOEE shift data collection sheet
Print one sheet per shift and equipment: hourly counts, a coded stop log, efuda tag column and a product change line
- Pages
- 2
- A4 landscape
- Created
- 5 November 2026
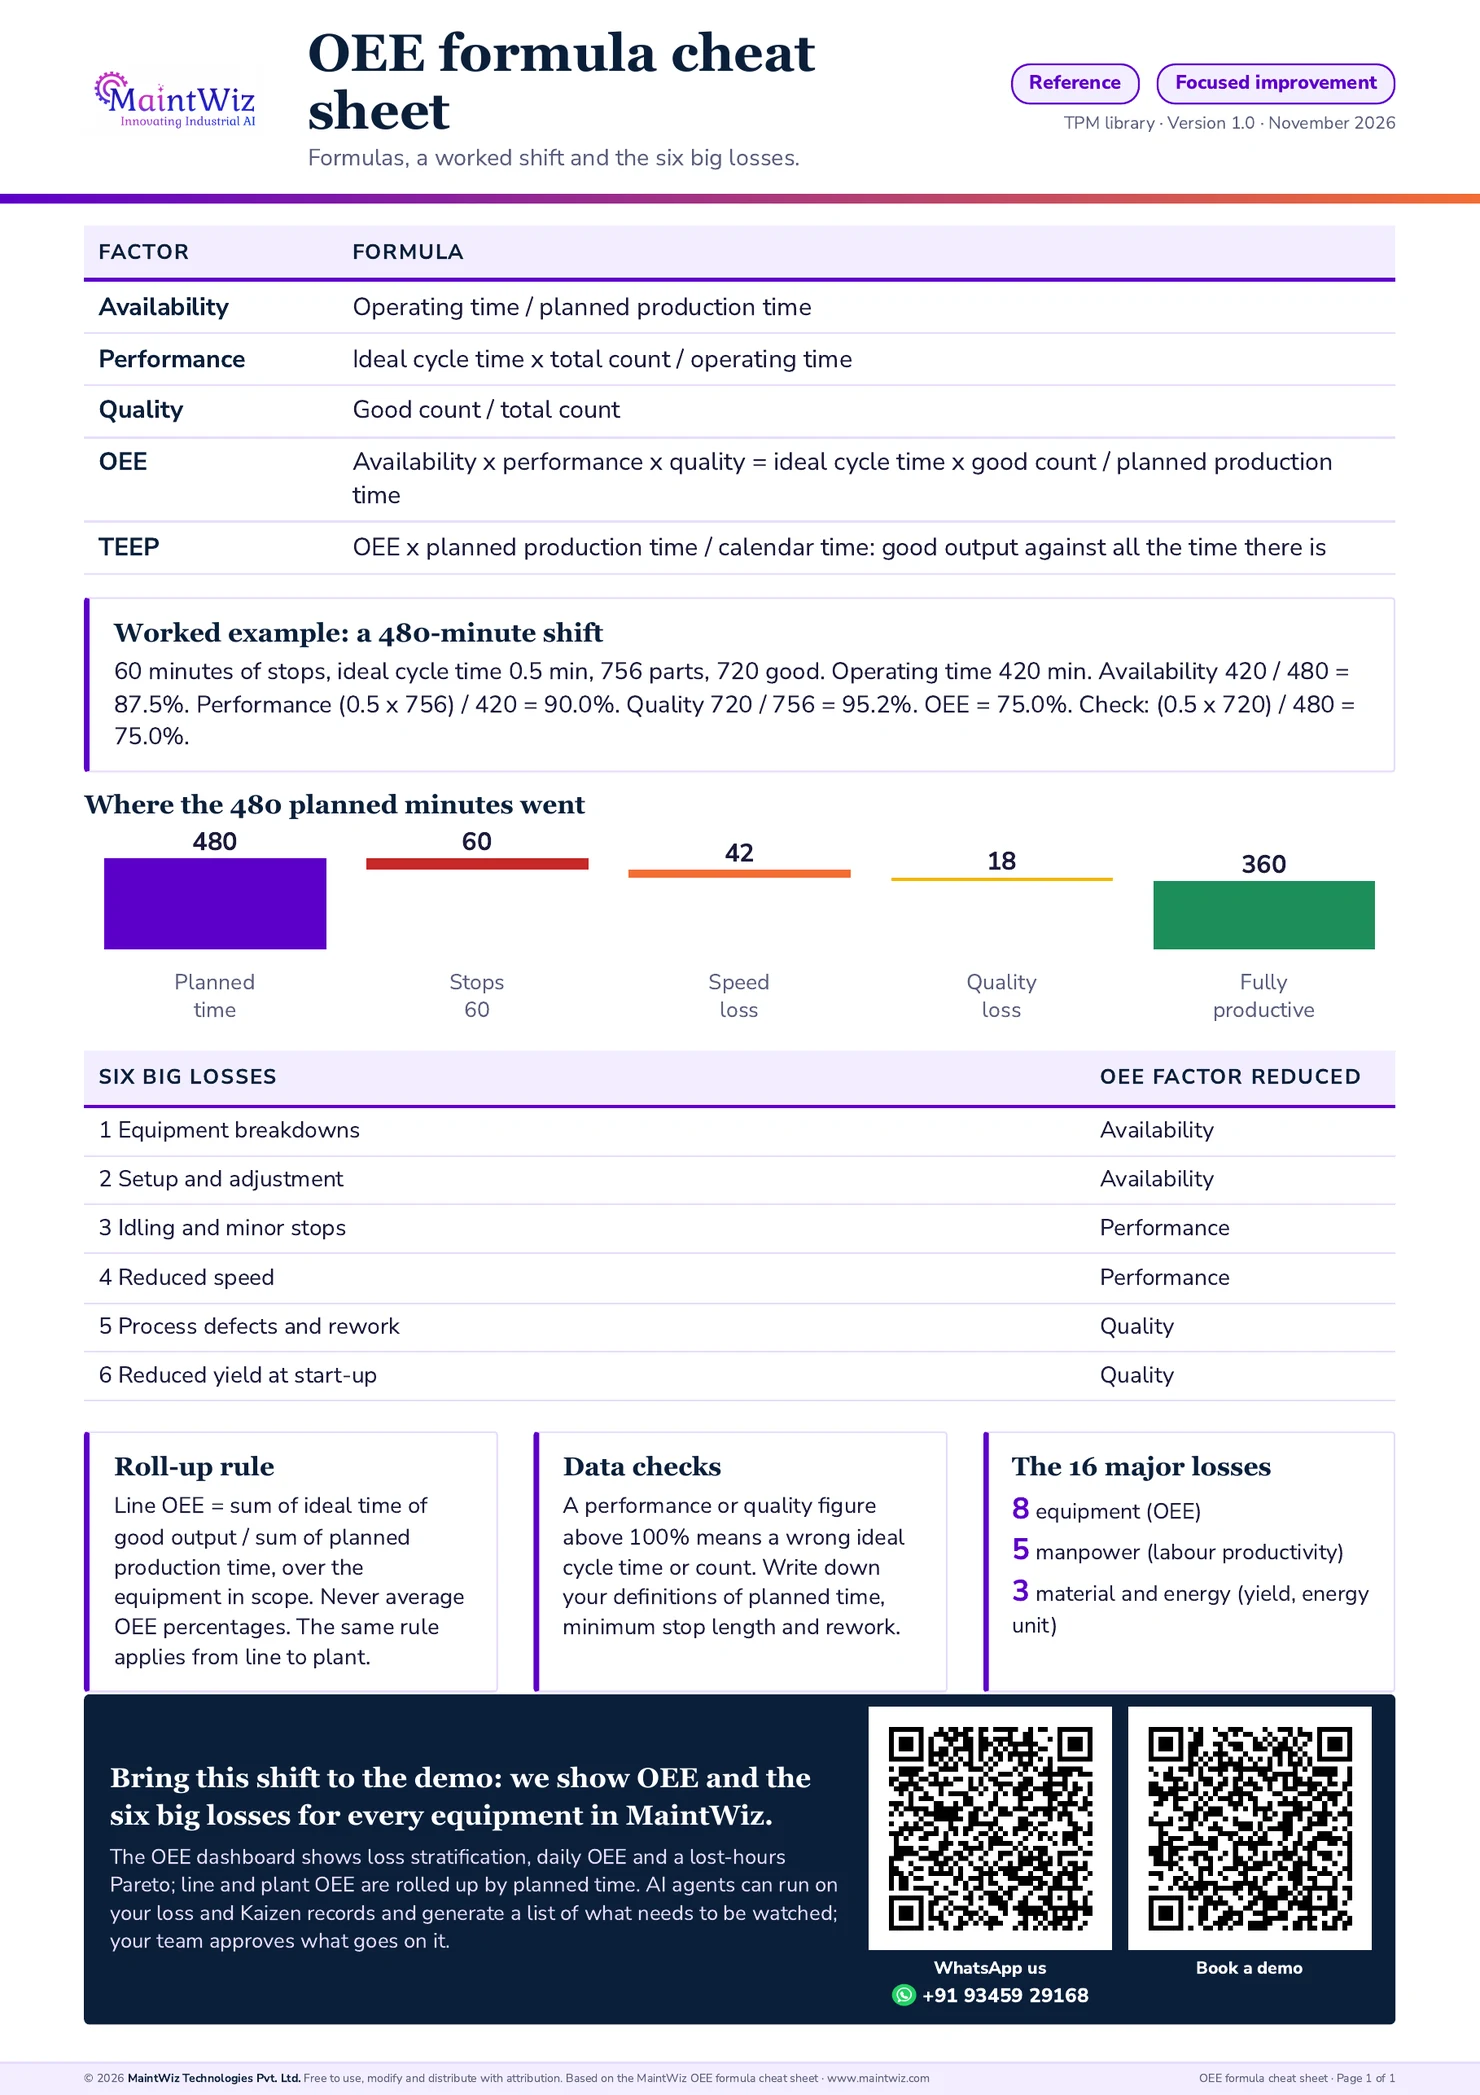
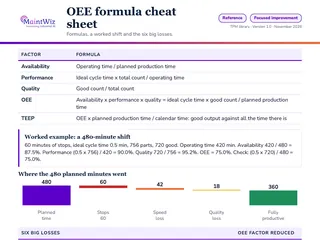 PDFOEE formula cheat sheet
Keep the OEE formulas, a worked 480-minute shift, the six big losses and the 16 major losses on one printable page
- Pages
- 1
- A4
- Created
- 5 November 2026
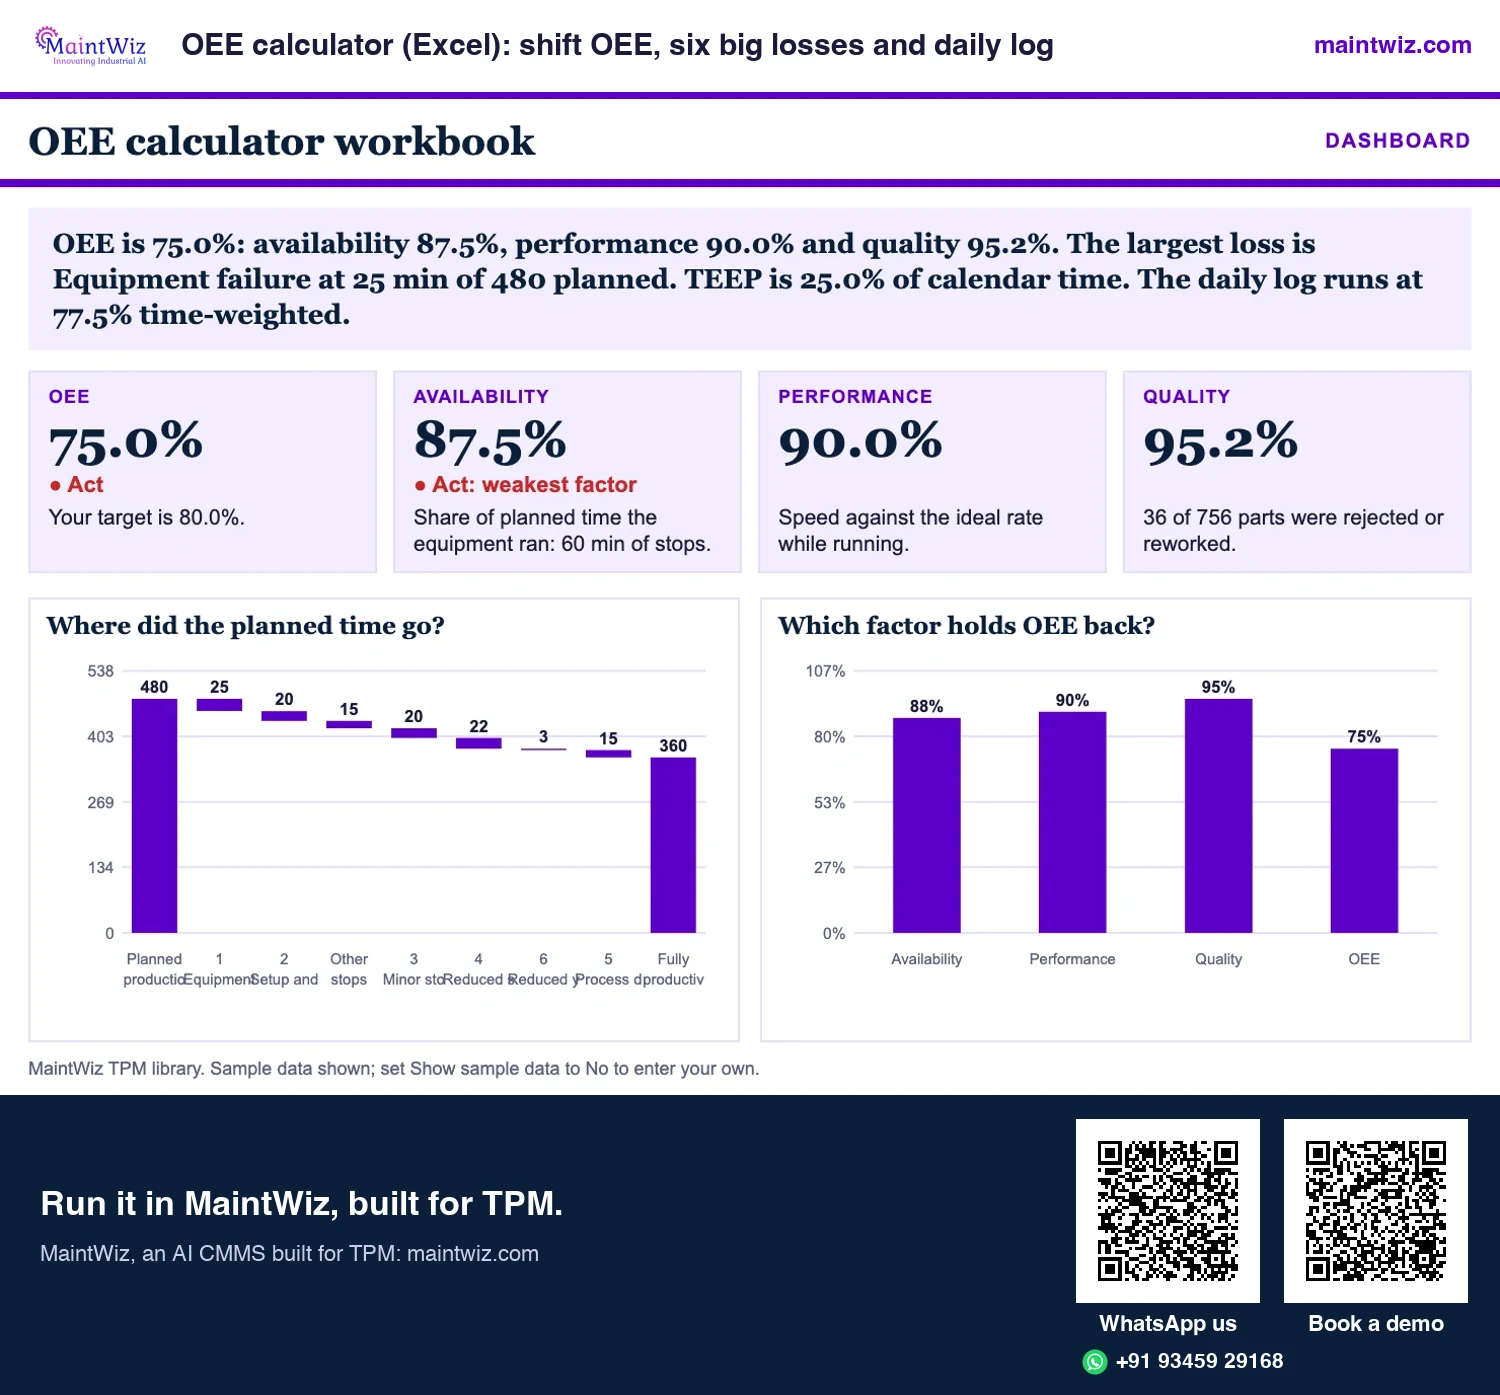
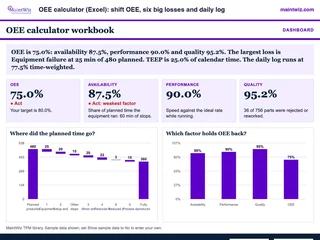 ExcelOEE calculator (Excel): shift OEE, six big losses and daily log
Type one shift and see OEE, the three factors and where every planned minute went
- Sheets
- Dashboard, Shift calculator, Daily log, 480 min shift, Two products in one shift, Read me
- A4
- Version
- v1.1, 5 November 2026
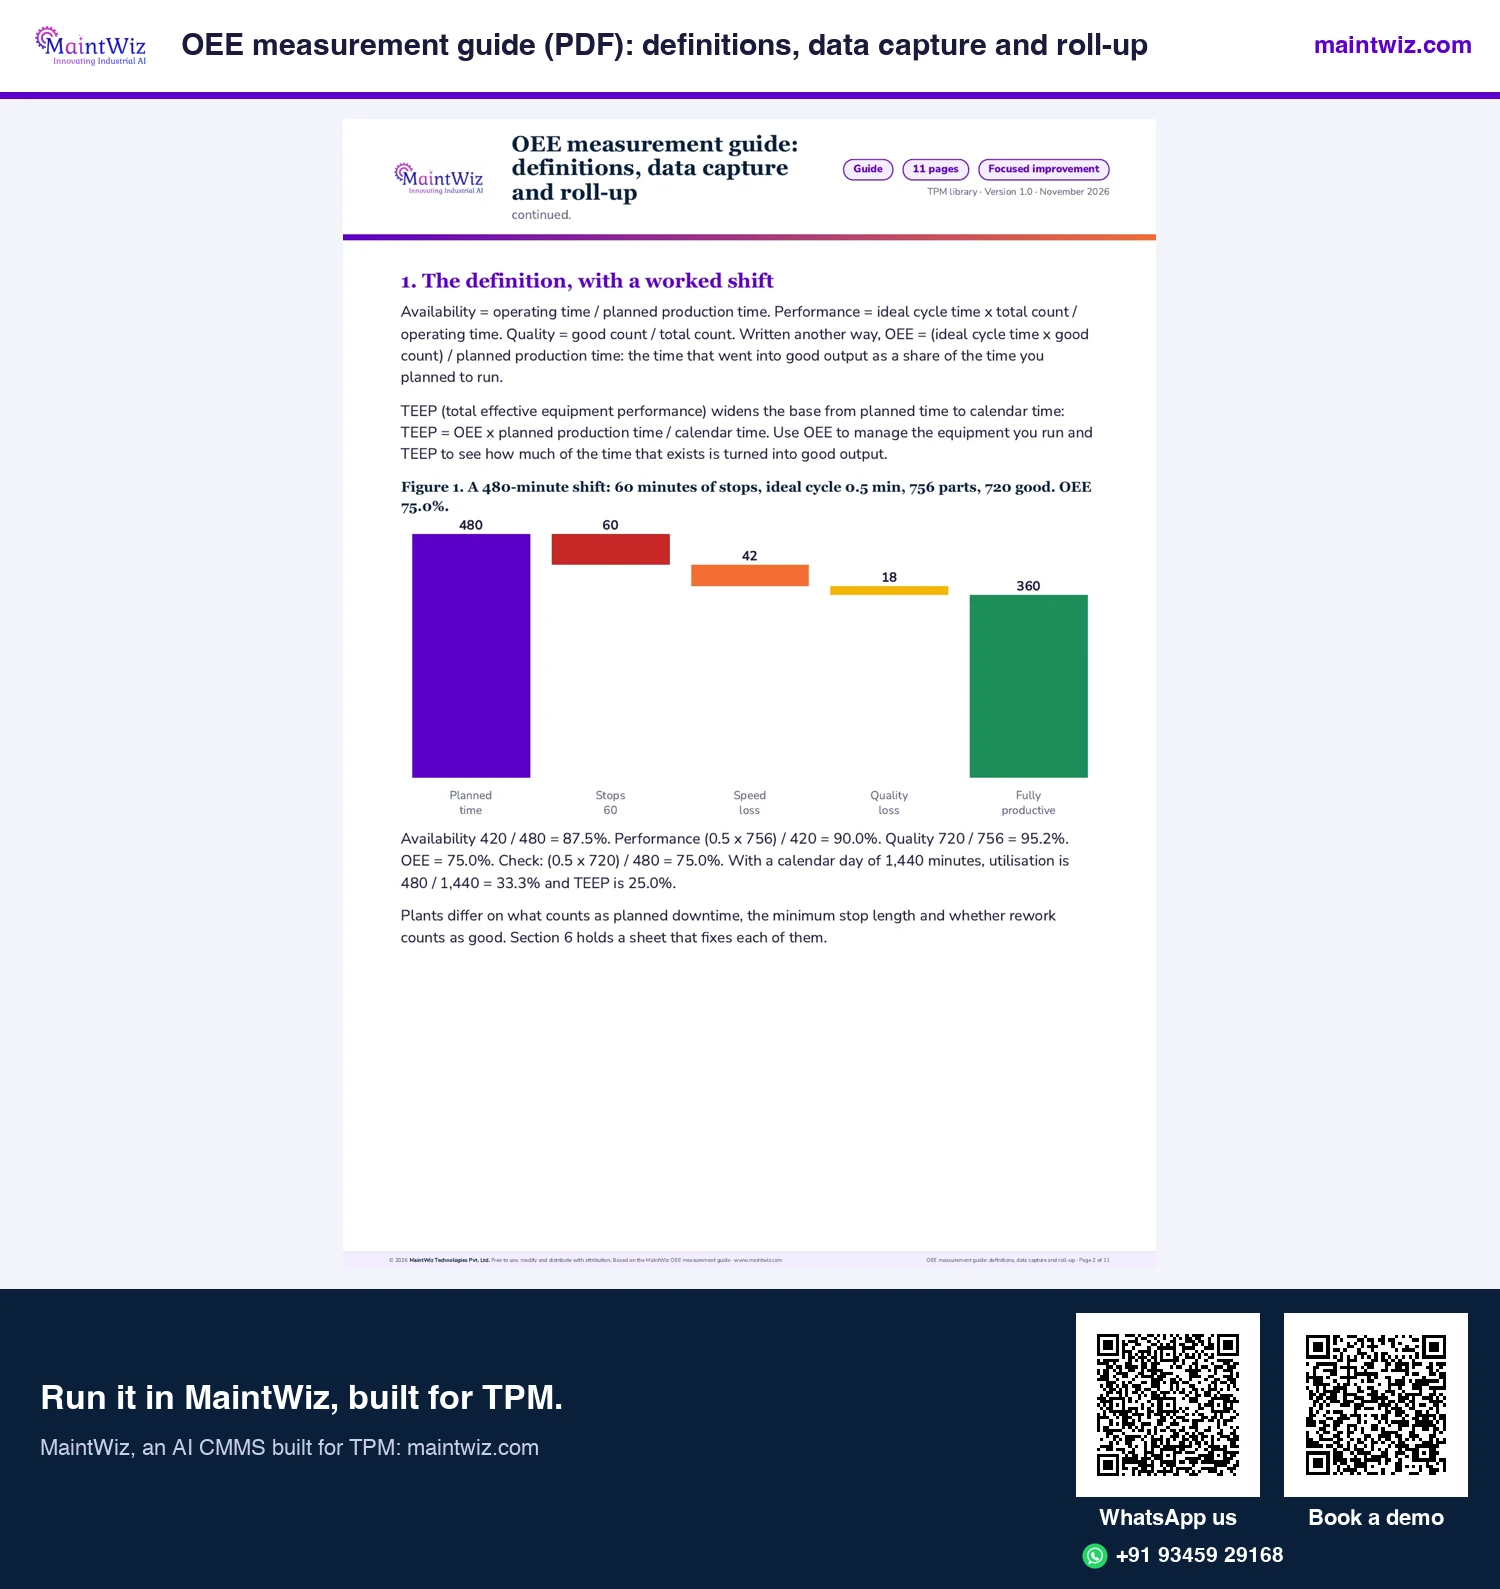
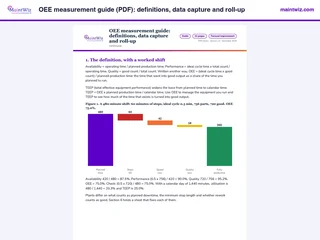 PDFOEE measurement guide (PDF): definitions, data capture and roll-up
Agree one OEE definition, choose a data capture route and roll results up from equipment to plant
- Pages
- 11
- A4
- Created
- 5 November 2026
How it works
How does OEE software work?
Every type follows the same chain. Inputs arrive each shift, the three factors are calculated against planned time, the losses are ranked, and the largest goes to a team with an owner and a date (Figure 1).
How OEE software turns shop-floor data into action
Four inputs, one calculation, a ranked loss list and an owner for the largest loss
- 1
Planned time
Shift time minus planned breaks and planned stops
- 2
Stops and counts
Every stop with its reason; total and good output
- 3
Ideal cycle time
The benchmark rate for each product on each equipment
- 4
Calculate
Availability × performance × quality = OEE
- 5
Rank
Lost hours by reason on a Pareto
- 6
Act
The largest loss goes to a work order, a Kaizen or a pillar team, with an owner and a date
Next month's OEE shows whether the action held
 maintwiz.comAI CMMS built for TPM
 WhatsApp us
 +91 93459 29168
 Book a demo
How are the three factors calculated?
Availability is run time divided by planned production time. Performance is ideal cycle time multiplied by total count, divided by run time. Quality is good count divided by total count. OEE is availability × performance × quality; ISO 22400-2:2014 defines the OEE index as availability × effectiveness × quality ratio. One written rule for planned time, minimum stop length and rework keeps the figure comparable between shifts and plants, so the OEE formula gives the same answer on every 480-minute shift.
How does a ranked loss become an action?
Breakdowns go to planned maintenance and Jishu Hozen, set-up losses to SMED and Kobetsu Kaizen, minor stops and speed losses to Kobetsu Kaizen, defects to quality maintenance and start-up losses to early equipment management, following the six big losses. This is where OEE software earns its place: when the loss and the work that removes it sit on the same equipment record, next month's OEE shows whether the fix held.
Features
What features does OEE software have?
Six features do the work in every type of OEE software.
- Stop capture with reasons: every stop logged with its equipment, duration and a reason from a coded list.
- Total and good counts for each shift, so performance and quality come from the same records.
- Ideal rates held per product and equipment, the benchmark behind performance.
- Factor calculation: availability, performance, quality and OEE against planned production time.
- Loss Pareto: lost hours ranked by reason, so the largest loss is worked first.
- Roll-up from equipment to line and plant by adding times, not averaging percentages.
Types
What types of OEE software are there?
Four types are in common use. They differ in where stop and count data comes from and in what the plant can do with a loss once found; many plants run machine signals on the bottleneck and operator entry elsewhere.
| Type | How it captures data | What it is good at | What to check |
|---|---|---|---|
| Manual or operator entry (tablet or terminal) | Operators log stops, reasons and counts during the shift from a reason code list | Quick to start on any machine; the person who saw the stop gives the reason | Taps per stop; whether short stops get logged; how counts are checked |
| Sensor or machine-signal based | A sensor, PLC tag or machine control reports run, stop and count signals | Exact stop times and counts, including minor stops a person would miss | Who adds the reason to each stop; hardware per machine; lines without a signal |
| MES-based | Calculated in the manufacturing execution system from production orders, counts and machine states | Ties OEE to the orders, products and batches the MES schedules | Whether maintenance sees the same losses; whether line and plant roll-up adds times |
| CMMS-based | Operator entry or connected IoT, MES, SCADA, PLC and DCS sources, held against the same equipment as work orders | The loss and the work order, PM or Kaizen that removes it sit on one equipment record | Mobile or terminal stop entry; line and plant roll-up; TPM pillar records on the same equipment list |
Where does CMMS-based OEE fit?
CMMS-based OEE suits a plant that runs Total Productive Maintenance, because the loss, the tag, the work order and the Kaizen sheet are records on one equipment list. MaintWiz is built this way, and SAP PM and MM connect through web services. MaintWiz OEE software shows each equipment's loss stratification, daily OEE and lost-hours Pareto, rolled up to line and plant by planned time.
vs spreadsheet, MES
How does OEE software compare with a spreadsheet and an MES?
A spreadsheet, an MES and OEE software in a CMMS can all produce an OEE figure. They differ in how the data gets in, where the definitions are held and what happens after a loss is found.
| Question | Spreadsheet | MES | OEE software in a CMMS |
|---|---|---|---|
| How do stops and counts get in? | Typed from paper sheets after the shift | From production orders and machine states | Operator entry on mobile or terminal, or connected IoT, MES, SCADA, PLC and DCS sources |
| Where are definitions held? | In formulas each user can change | In the MES configuration | Ideal rates, loss codes and planned time held once per equipment |
| How is OEE rolled up? | Often an average of percentages | Along the MES model of lines and orders | Adds planned time and ideal time of good output from equipment to line and plant |
| What happens after a loss is found? | A separate action list | A hand-off to the maintenance system | Work orders, Kaizen and pillar records on the same equipment |
A spreadsheet is a sound place to agree definitions on one pilot line, and the OEE calculator does the arithmetic; once several lines report, OEE software adds the loss list, the roll-up and the follow-up. Plants with both systems keep orders and counts in the MES and equipment, work orders and losses in the CMMS, so each record has one home in a CMMS, MES and EAM set-up for TPM.
Sensors
Do you need sensors for OEE software?
No. Operator entry gives a working OEE from the first shift on any machine, including machines without a PLC. Sensors and machine signals add exact stop times and catch the minor stops people miss, so plants often add them first on the bottleneck. A person still gives the reason for each stop.
In MaintWiz, operators enter stops and counts on a mobile device or terminal; MaintWiz can connect IoT, MES, SCADA, PLC and DCS sources. Either way, the stops show in the same OEE views, lost-hours Pareto and downtime report.
Data needed
What data does OEE software need?
Four inputs per equipment are enough to calculate OEE and rank its losses.
| Data | Used for | Usual source |
|---|---|---|
| Planned production time | The base of availability | Shift calendar minus planned breaks and planned stops |
| Stops with reasons | Availability loss and the loss Pareto | Operator entry or a machine signal, plus a reason code |
| Total and good counts | Performance and quality | Counter, PLC tag or operator count at shift end |
| Ideal cycle time per product | The performance benchmark | A capacity master per product and equipment |
Free-text stop reasons are the most common gap. A list of downtime reason codes mapped to the six big losses keeps stops groupable from day one; in MaintWiz loss codes and capacities are set up per plant.
Loss stratification
What is loss stratification?
Loss stratification splits the gap between 100% and the measured OEE into three layers, availability, performance and quality, and then into the loss categories under each. For example, a line with availability 90%, performance 85% and quality 94% runs at an OEE of 71.9%. Of the 28.1-point gap, 10.0 points are availability loss, 13.5 points performance loss and 4.6 points quality loss, so speed and minor stops come first.
The MaintWiz OEE dashboard shows loss stratification for each equipment beside the daily OEE calendar and the lost-hours Pareto.
How to choose
How do you choose the right type of OEE software?
Pick operator entry where machines have no PLC, machine signals on the bottleneck, MES-based OEE where production orders already run in an MES, and CMMS-based OEE where each loss must reach the maintenance team on the same equipment record.
- Most stops are long and well understood: operator entry on a terminal or mobile device gives OEE fastest.
- Minor stops and speed loss dominate: add machine signals on the bottleneck first.
- Production orders already run in an MES: check that maintenance sees the same losses and reason codes.
- The plant runs TPM: keep OEE on the same equipment list as work orders and pillar records.
Then test it on your own line. MaintWiz OEE software tracks stops, counts and losses by equipment, line and plant, and the whole TPM, all eight pillars with 5S, Kaizen and one point lessons, rolls out in 6 to 8 weeks with easy Excel uploads. Book a demo and bring a week of your stop records.
With eight OEE tools compared side by side, the widest gap is what happens after the loss is found: work orders, tags, 5S, Kaizen and training on the same equipment list.
FAQ
Frequently asked questions
What is an OEE system?
An OEE system is OEE software plus the definitions, reason codes and routines that keep the figure reliable: a written planned-time rule, one ideal cycle time per product, a reason list mapped to the six big losses and a regular review of the loss Pareto. MaintWiz holds all of these against the equipment, beside work orders.
What is OEE monitoring software?
OEE monitoring software shows availability, performance and quality for each equipment by shift and day and shows where the time went, so a growing loss is seen early. In MaintWiz the OEE dashboard per equipment shows loss stratification, daily OEE and a lost-hours Pareto, rolled up to line and plant.
What is OEE downtime tracking software?
OEE downtime tracking software logs each stop with its equipment, duration and reason code, then ranks the reasons so the largest losses are worked first. In MaintWiz the downtime report splits downtime into unplanned, planned and performance loss, with a list view of the events and a lost-hours Pareto.
What are the types of OEE software?
There are four: operator entry on a tablet or terminal, sensor or machine-signal capture, MES-based OEE calculated from production orders, and CMMS-based OEE held on the same equipment list as work orders and TPM pillar records. Plants often combine operator entry with machine signals on the bottleneck.
What data is needed to calculate OEE?
Four inputs per equipment: planned production time, every stop with its duration and reason, total and good counts, and the ideal cycle time for each product. With those, availability, performance and quality follow, and the stops give the loss Pareto. MaintWiz holds all four against the equipment, so each figure traces back to its records.
Do I need sensors to track OEE?
No. Operators can enter stops, reasons and counts on a mobile device or at a terminal from the first shift. Sensors and machine signals add exact stop times and catch minor stops; MaintWiz can connect IoT, MES, SCADA, PLC and DCS sources, and the same OEE views, lost-hours Pareto and downtime report show both.
What is loss stratification?
Loss stratification splits the gap between 100% and your OEE into availability, performance and quality losses, then into the loss categories under each. It shows which factor costs the most time before you drill into the reasons. MaintWiz shows it on the OEE dashboard for each equipment, beside daily OEE and the lost-hours Pareto.
Is OEE software the same as an MES?
No. An MES runs production orders, batches and routing and can calculate OEE as one of its outputs. OEE software centres on stops, counts and losses by equipment. MaintWiz holds OEE beside work orders and the TPM pillars, and MaintWiz can connect IoT, MES, SCADA, PLC and DCS sources.
Can I track OEE in Excel?
Yes, for one line and a few shifts: the free OEE calculator workbook does it. Past that, definitions and reason lists drift between files; OEE software holds the same definitions for every equipment and every shift.
Sources
Sources
- ISO 22400-2:2014, Automation systems and integration: Key performance indicators (KPIs) for manufacturing operations management, Part 2: Definitions and descriptions https://www.iso.org/standard/54497.html