
Key takeaways
- P stands for phenomenon and physical analysis; M for mechanism and the factors of machine, man, material and method (the four Ms).
- It targets chronic losses with several interacting causes, where a simple why-why analysis finds one cause and the problem returns.
- The method lists every condition that could produce the phenomenon, checks each against standard, and corrects all that are out.
- MaintWiz is an AI CMMS built for TPM: each P-M correction is logged as a Kaizen idea sheet or poka-yoke sheet, and the loss cost master puts a cost on the loss it attacks. All eight pillars, 5S, OEE, Kaizen and one point lessons run in one AI CMMS, operators capture on mobile, tags become work orders, IoT signals raise work orders and ePTW covers safety. The whole roll-out takes 6 to 8 weeks.
P-M analysis
What is P-M analysis?
P stands for phenomenon and physical analysis; M stands for mechanism and the four Ms (machine, man, material, method). The idea is to describe the phenomenon exactly, explain it in terms of physical principles, find every condition that could cause it through the mechanism, and then check and correct each condition rather than only the most obvious one. Kobetsu Kaizen (focused improvement), where the method sits, is one of the four core pillars that JIPM, the Japan Institute of Plant Maintenance, lists for TPM.
A chronic loss often has several contributing causes, each small, which interact. A team that finds one cause, fixes it and sees the loss fall a little then stop falling has met this. P-M analysis forces the team to list all the conditions, which is why it is slower than a quick root-cause search and why it works on problems that quick searches leave behind.
The steps of P-M analysis
P: Phenomenon, Physical · M: Mechanism and the 4M (Machine, Man, Material, Method)
Clarify the phenomenon
Investigate the phenomenon
Explain it physically
List the conditions
Examine the four Ms
Set standard values and tolerances
Investigate and measure
Correct and verify
 maintwiz.comAI CMMS built for TPM
 WhatsApp us
 +91 93459 29168
 Book a demo
Downloads
P-M analysis template and worksheet (Excel)
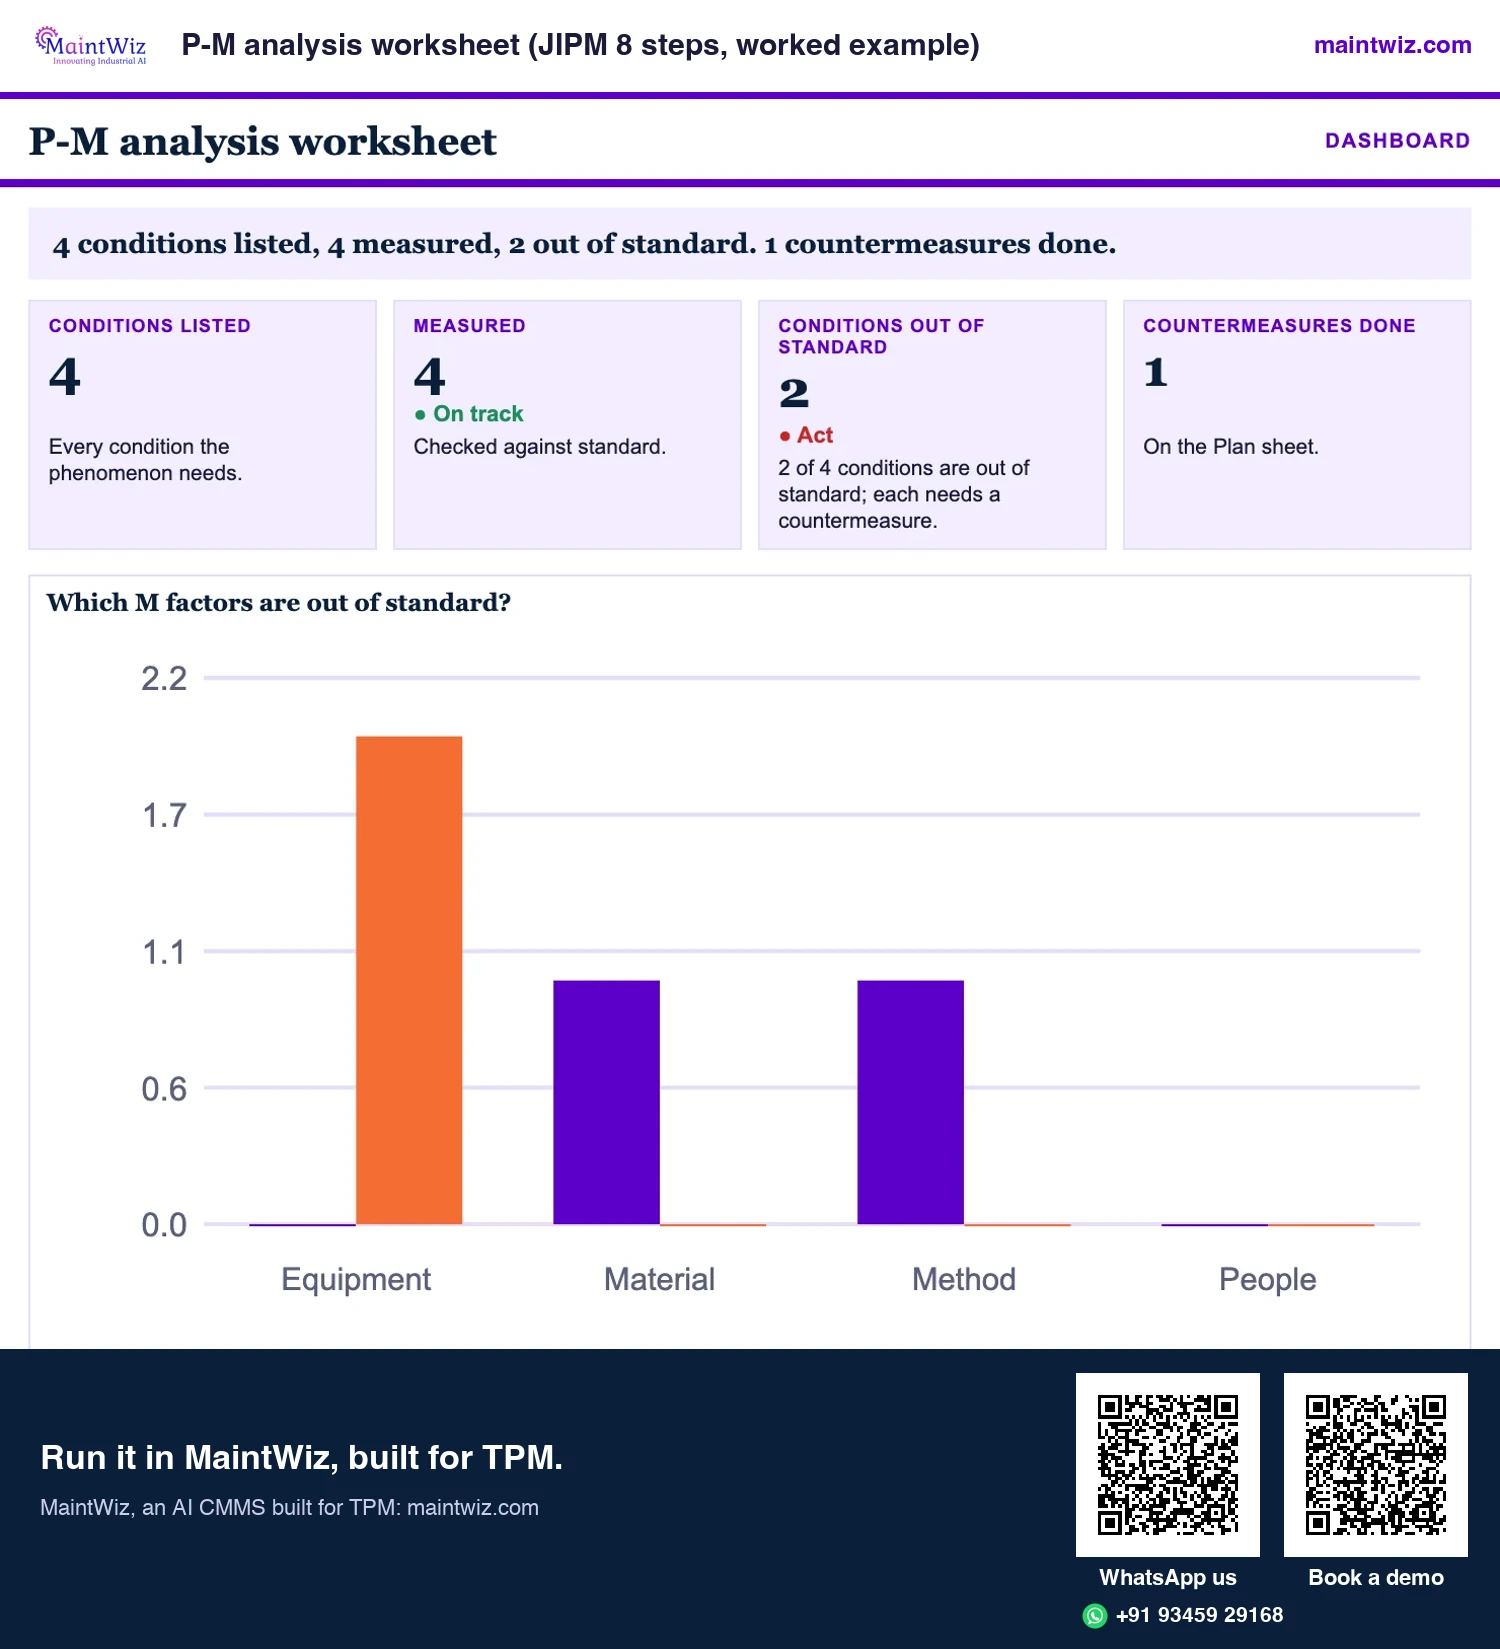
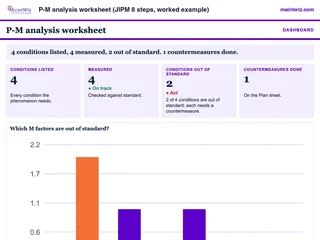 ExcelP-M analysis worksheet (JIPM 8 steps, worked example)
Work a chronic loss through the eight JIPM P-M analysis steps
- Sheets
- Dashboard, Inputs, Phenomenon, Principle, Conditions, Findings, Plan, Read me
- A4
- Version
- v1.1, 5 November 2026
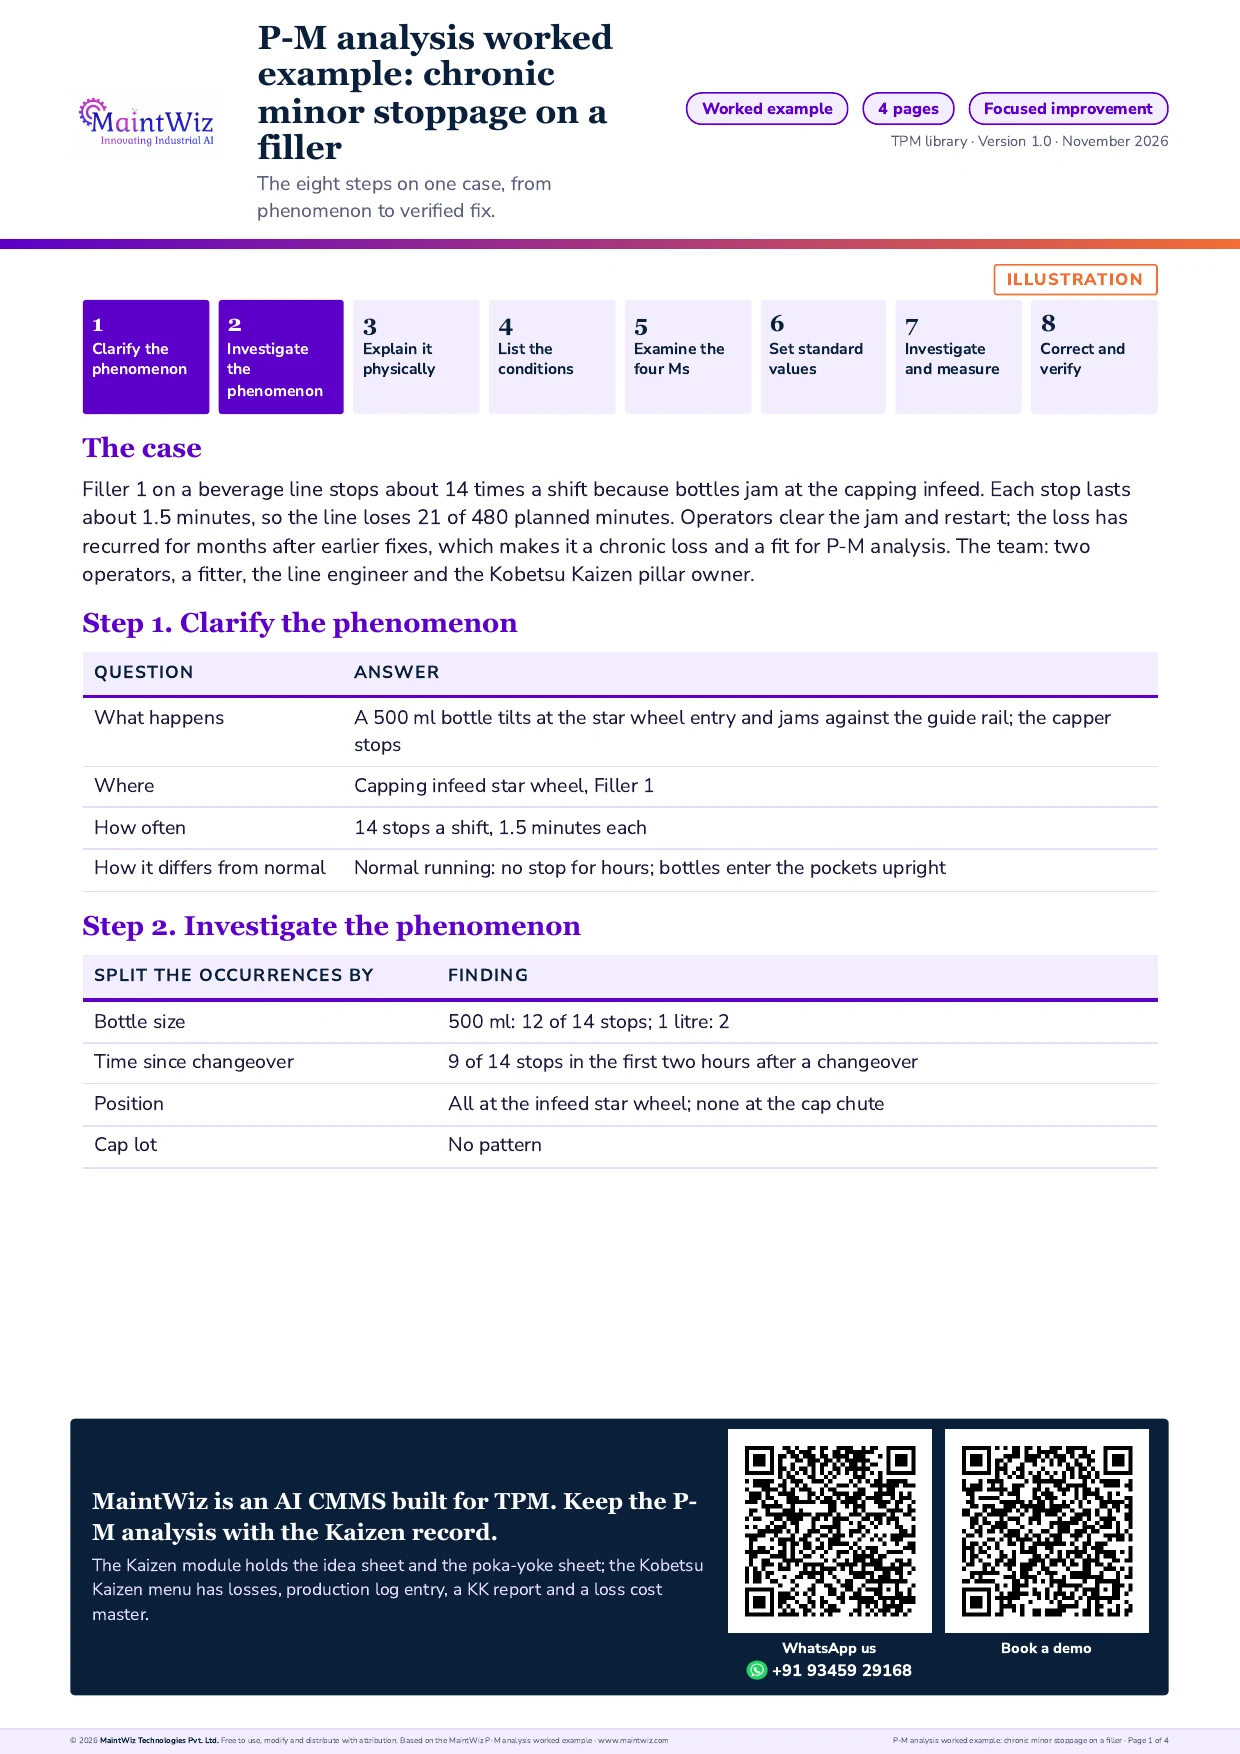
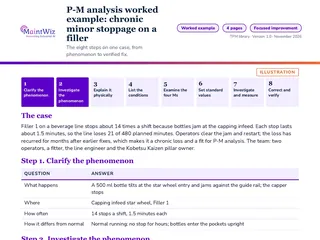 PDFP-M analysis worked example: chronic minor stoppage on a filler (4-page)
Follow all eight P-M analysis steps on one chronic minor stoppage on a filler, from phenomenon and conditions to the verified fix and the result.
Inside: Eight steps from clarifying the phenomenon to correcting and verifying · Case: filler capping infeed jam, 14 stops a shift of about 1.5 minutes · Phenomenon table and the four Ms conditions · Standard values, measurement and verified result · Four A4 pages
- Pages
- 4
- A4
- Created
- 5 November 2026
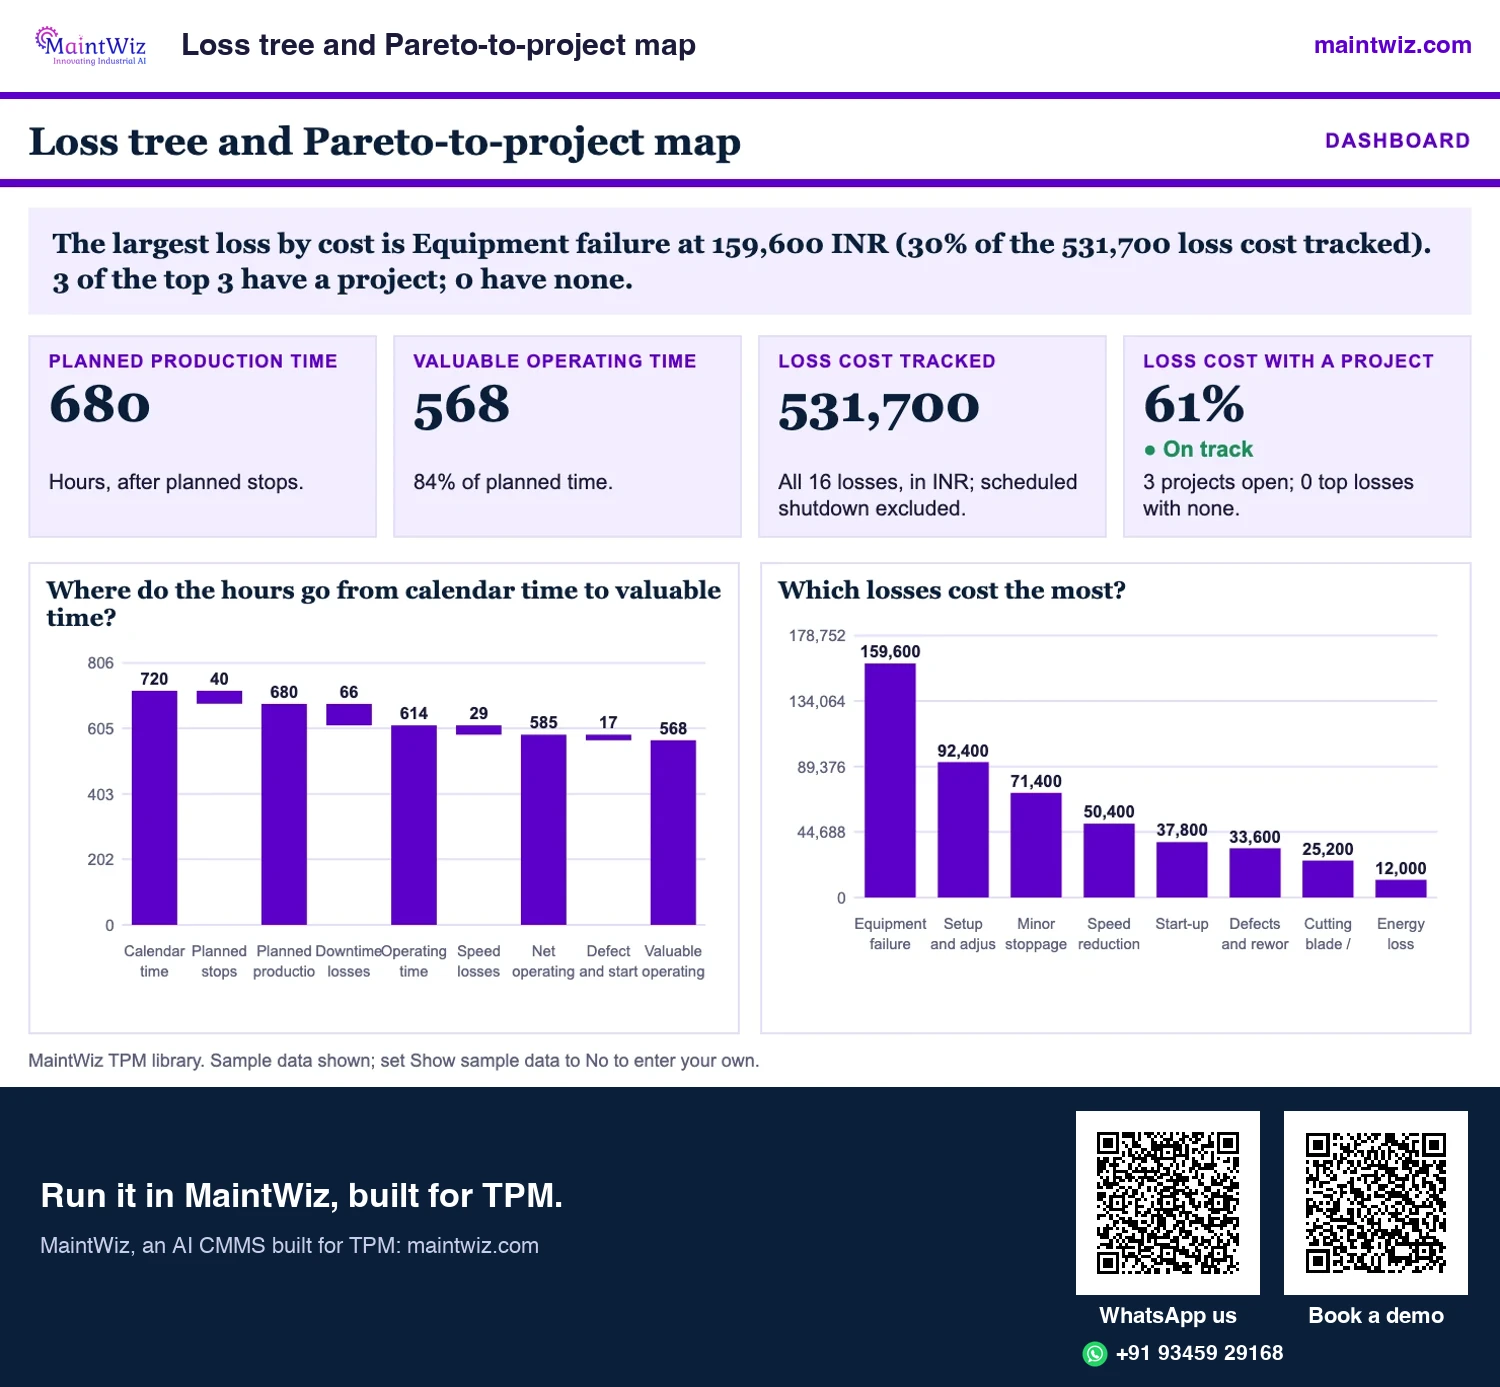
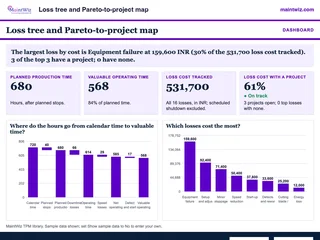 ExcelLoss tree and Pareto-to-project map
Build the loss tree from calendar time to valuable time, rank all 16 losses by cost
- Sheets
- Dashboard, Inputs, Tree, Project map, Pareto, Read me
- A4
- Version
- v1.1, 5 November 2026
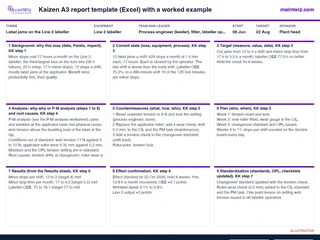 ExcelKaizen A3 report template (Excel) with a worked example
Run a Kobetsu Kaizen project as an A3 report, with the Line 2 labeller project filled in from loss ranking to Yokoten
- Sheets
- Dashboard, Inputs, Results, A3 report, A3 report, 2-page print, Calc, Read me
- One large sheet, or two A4 pages
- Version
- v1.1, 5 November 2026
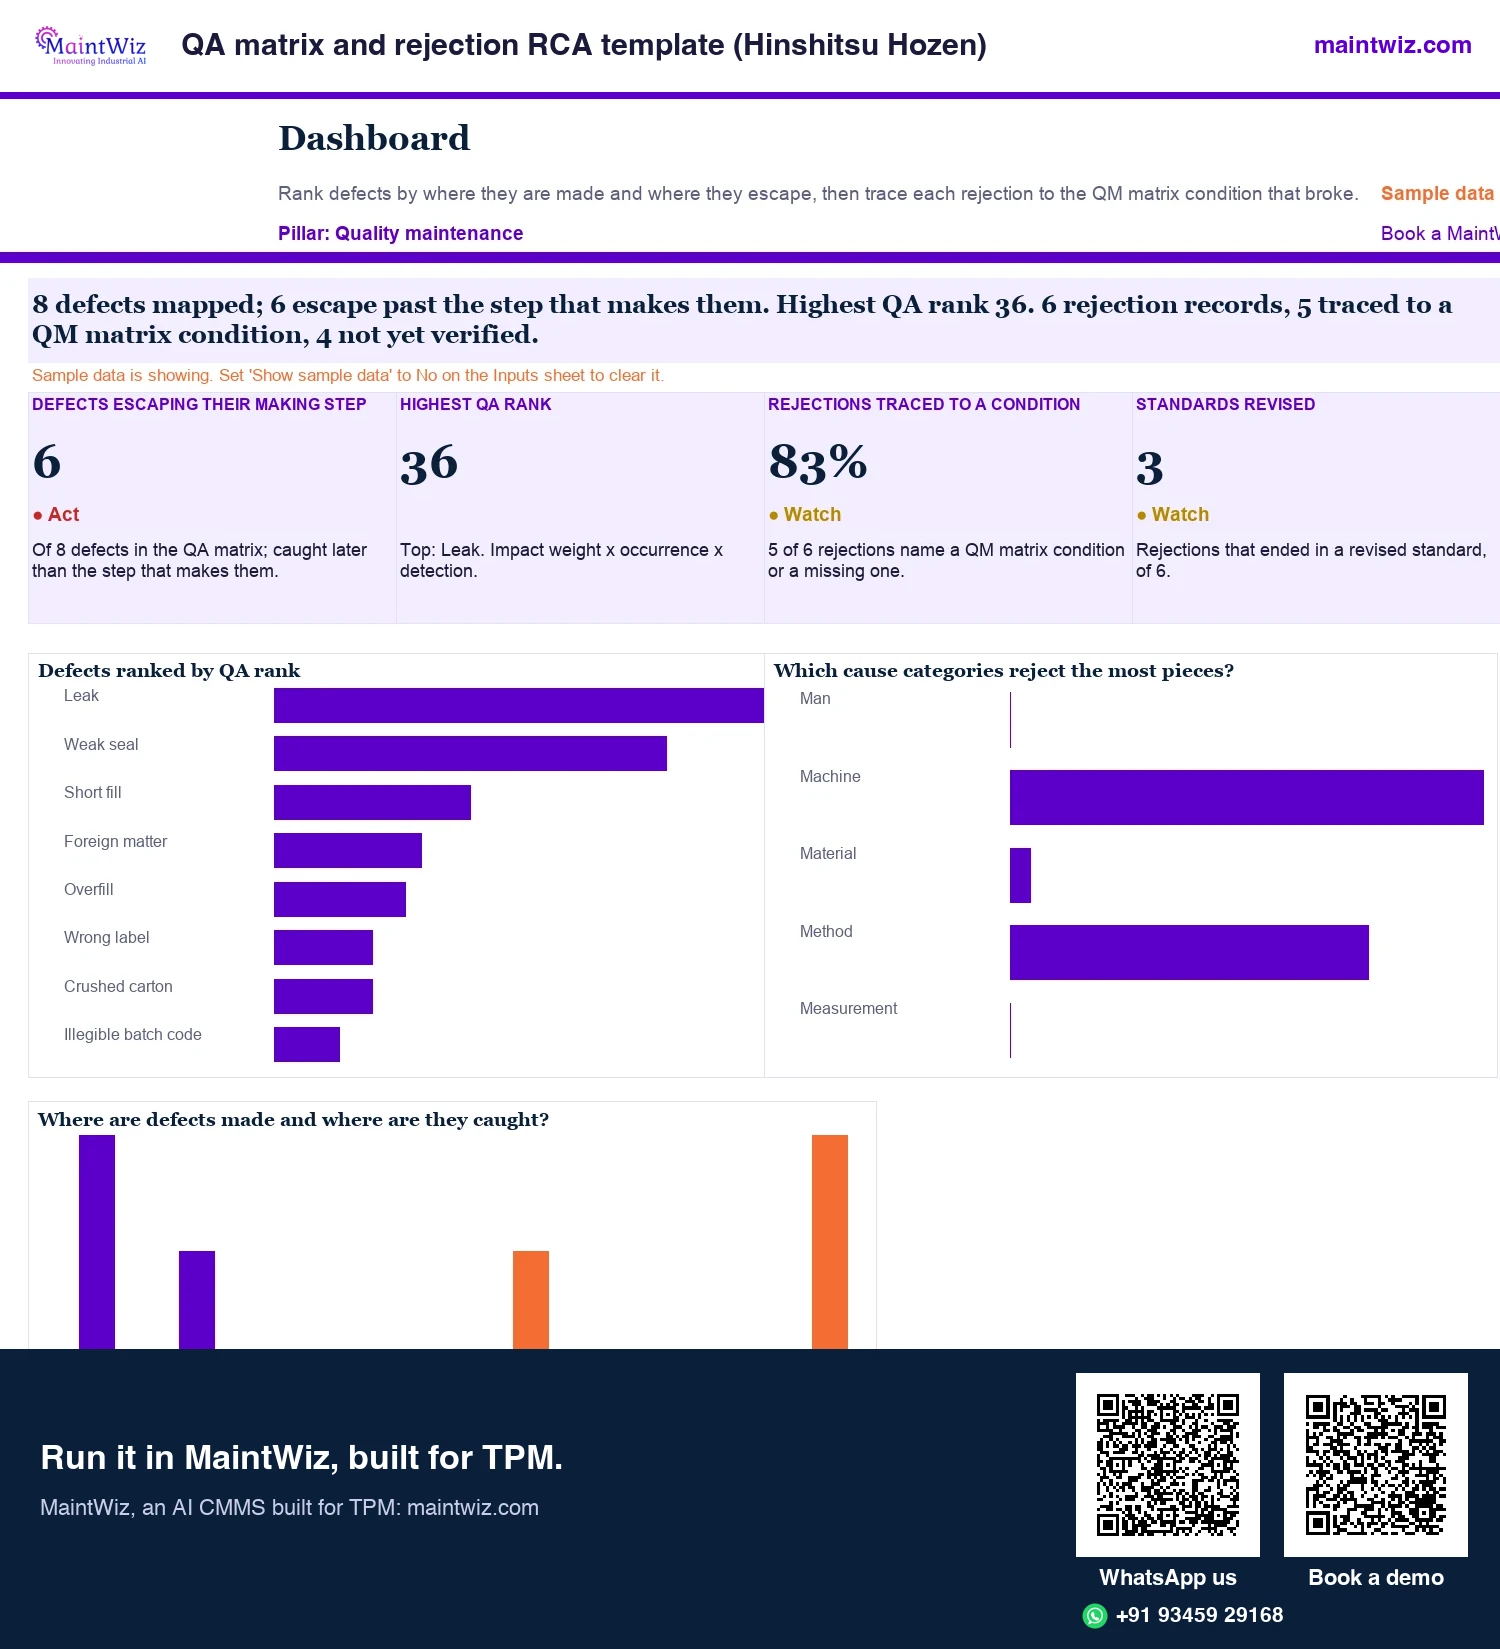
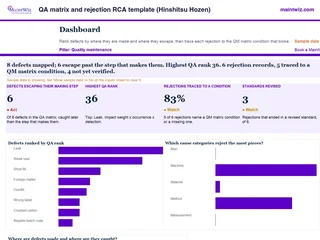 ExcelQA matrix and rejection RCA template (Hinshitsu Hozen)
Rank defects by where they are made and where they escape, then trace every rejection in quality maintenance to the QM matrix condition that broke.
Inside: QA matrix: mark where each defect is made, detected and should be detected · QA rank from customer impact weights A, B and C · Condition IDs pasted from the QM matrix with 4M type · Rejection RCA with five whys and the standard revised
- Sheets
- Dashboard, Inputs, QA matrix, Condition IDs, RCA, Read me
- A4
- Version
- v1.1, 5 November 2026
When to use
When should you use P-M analysis?
| Use P-M analysis when | Use a simpler method when |
|---|---|
| The loss is chronic and recurs after earlier fixes | The failure is sudden and has one clear cause |
| Several factors seem to act together | A single part has failed |
| The loss is at a modest level but adds up, such as a recurring defect or minor stop | A quick why-why analysis finds a cause that is then confirmed |
| The team can examine the equipment and the process closely | The data to analyse is not available and cannot be collected |
Steps
The steps of P-M analysis
| Step | What the team does | Output |
|---|---|---|
| 1. Clarify the phenomenon | Describe it precisely: what, where, when, how often, how much, and how it differs from normal | A written phenomenon statement with a photograph or measure |
| 2. Investigate the phenomenon | Observe it, classify its types and locations, and note patterns by time, product, equipment position | A stratified description of occurrences |
| 3. Explain it physically | Describe what physically happens, using the principles of the process: forces, flows, heat, friction | A physical explanation of how the phenomenon arises |
| 4. List the conditions | Identify the conditions that would have to be true for the phenomenon to occur | A list of necessary conditions |
| 5. Examine the four Ms | For each condition, list the machine, man, material and method factors that influence it | A factor list by condition |
| 6. Set standard values and tolerances | Decide the normal value and limit for each factor | Standards for each factor |
| 7. Investigate and measure | Check each factor against its standard, using inspection and measurement | Findings: which factors are out of standard |
| 8. Correct and verify | Restore every out-of-standard factor, then check that the phenomenon falls; update the standards | Result, standard and horizontal deployment |
Run it on a real loss. Get the P-M analysis worksheet and fill one row per condition.
Template and example
P-M analysis template and example
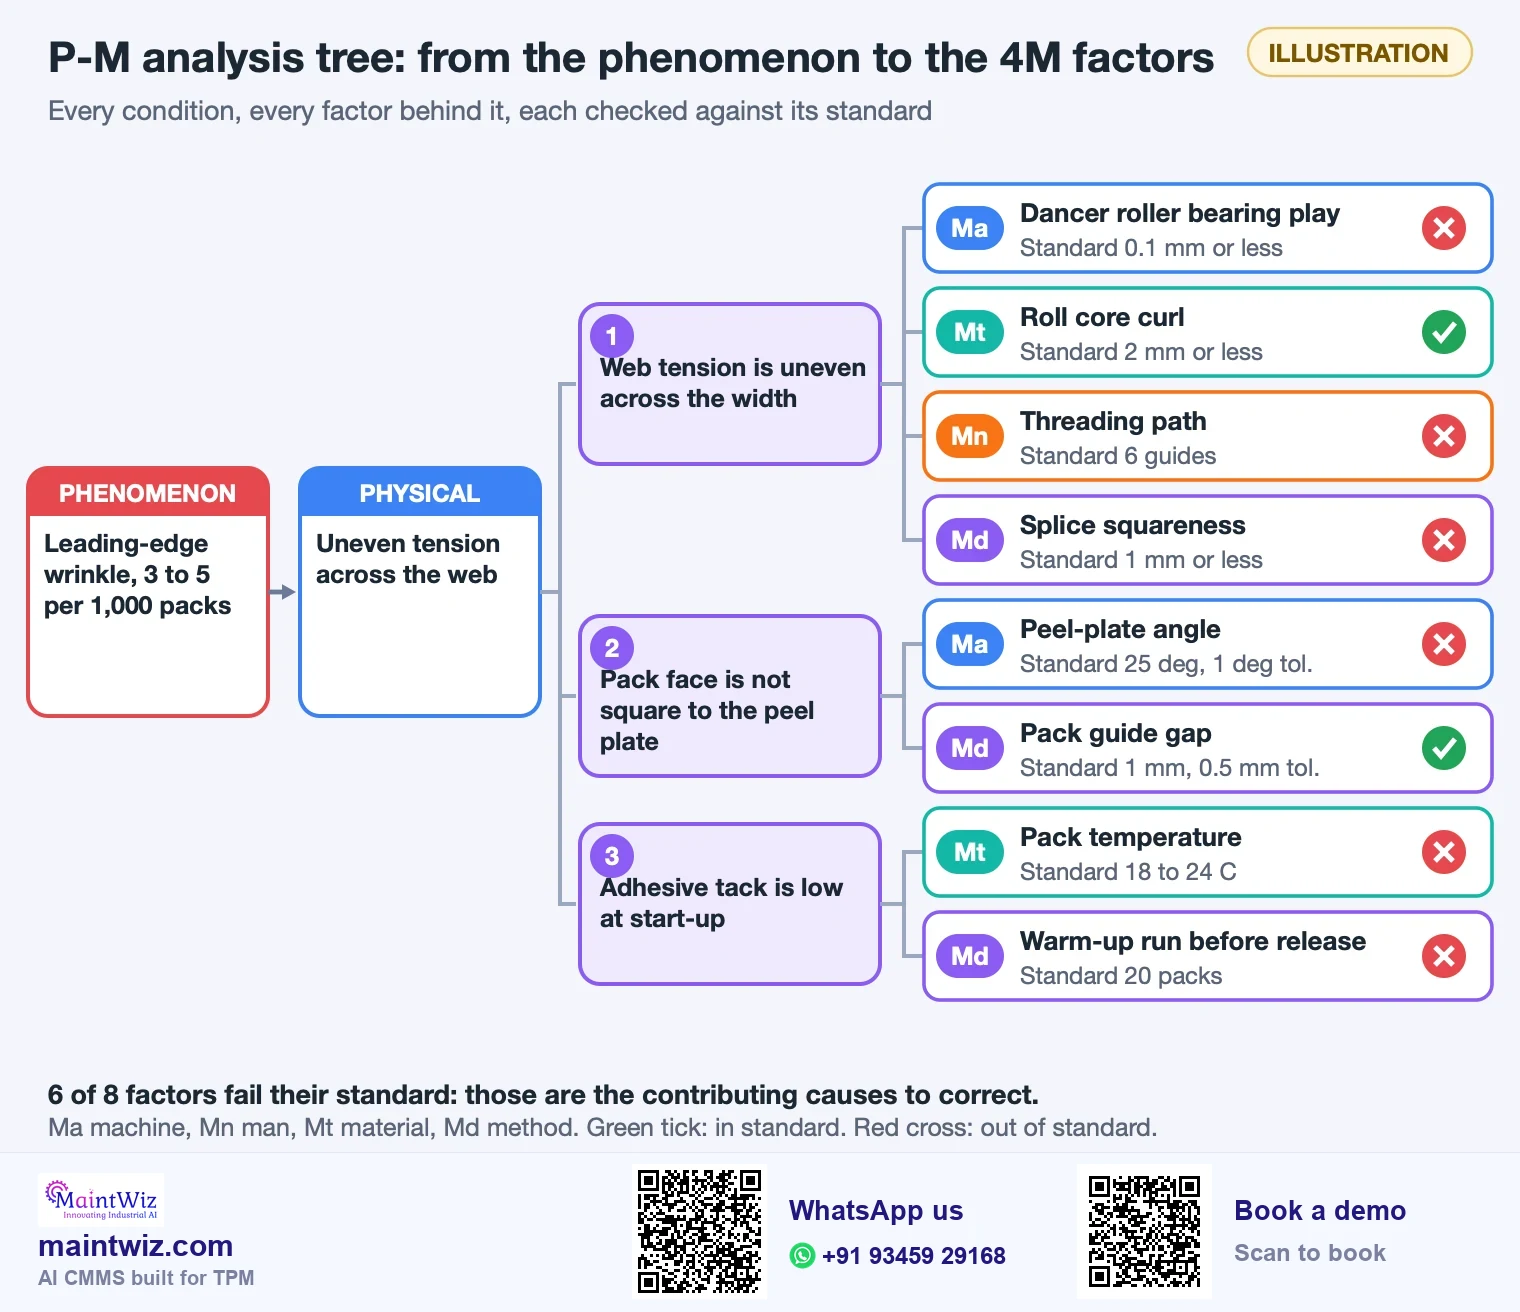
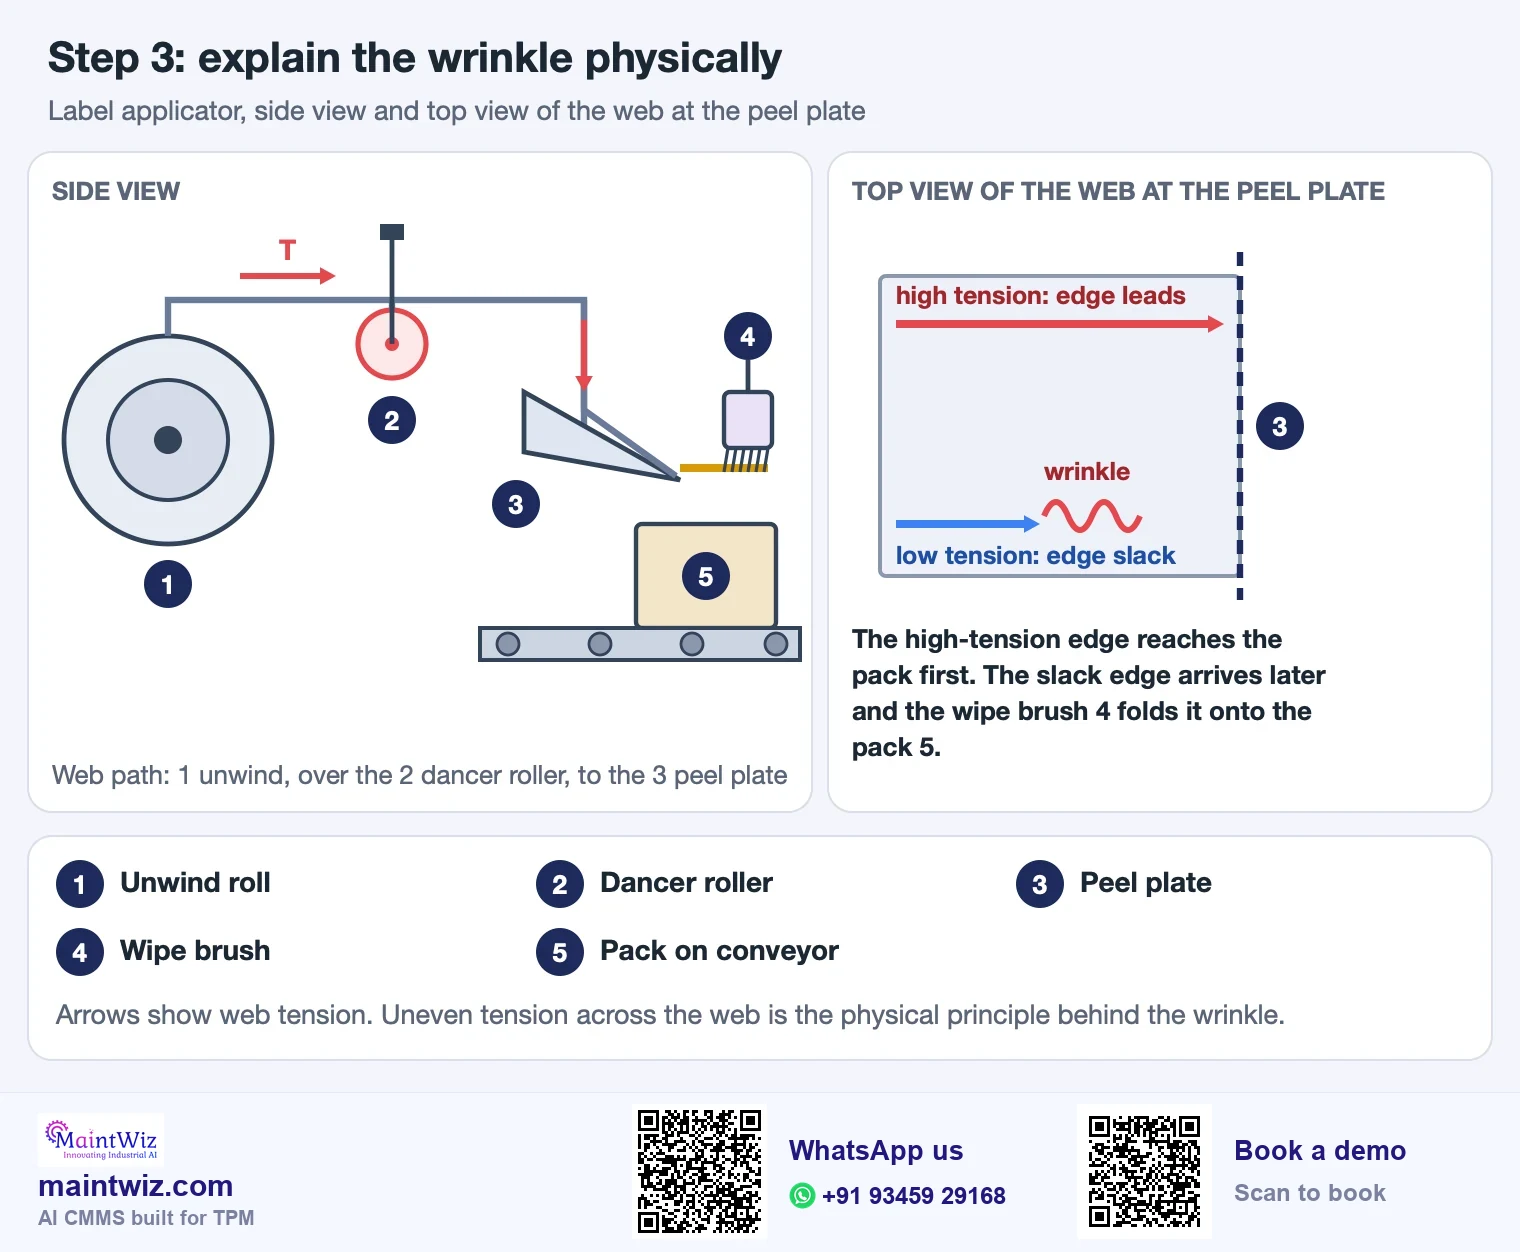
Take a labelling machine that leaves wrinkled labels now and then. The phenomenon statement gives the type of wrinkle, the position on the pack, the products and the time pattern. The worksheet then holds one row for each condition and factor.
The worksheet columns
| Column | What it holds |
|---|---|
| Phenomenon | The statement from step 1 |
| Physical principle | How the phenomenon arises physically |
| Condition | What must be true for it to occur |
| Factor and M | The machine, man, material or method factor that influences the condition |
| Standard and tolerance | Normal value and limit |
| Measured value | What was found |
| In standard? | Yes or no |
| Countermeasure and owner | The correction and who does it |
| Date and result | When it was done and what happened |
One completed row for the wrinkled-label case reads as follows.
| Column | Wrinkled labels: one completed row |
|---|---|
| Phenomenon | Leading-edge wrinkle on 3 to 5 labels per 1,000 packs, product B, first hour of the shift |
| Physical principle | The label meets the pack with uneven tension across the web, so one edge leads and the slack edge folds |
| Condition | Web tension must be even across the width of the web |
| Factor and M | Machine: dancer roller bearing play |
| Standard and tolerance | 0.1 mm or less |
| Measured value | 0.4 mm |
| In standard? | No |
| Countermeasure and owner | Replace the bearing and add a play check to the CIL standard; maintenance technician |
| Date and result | Date of the change; wrinkled labels counted over the next runs against the count before |
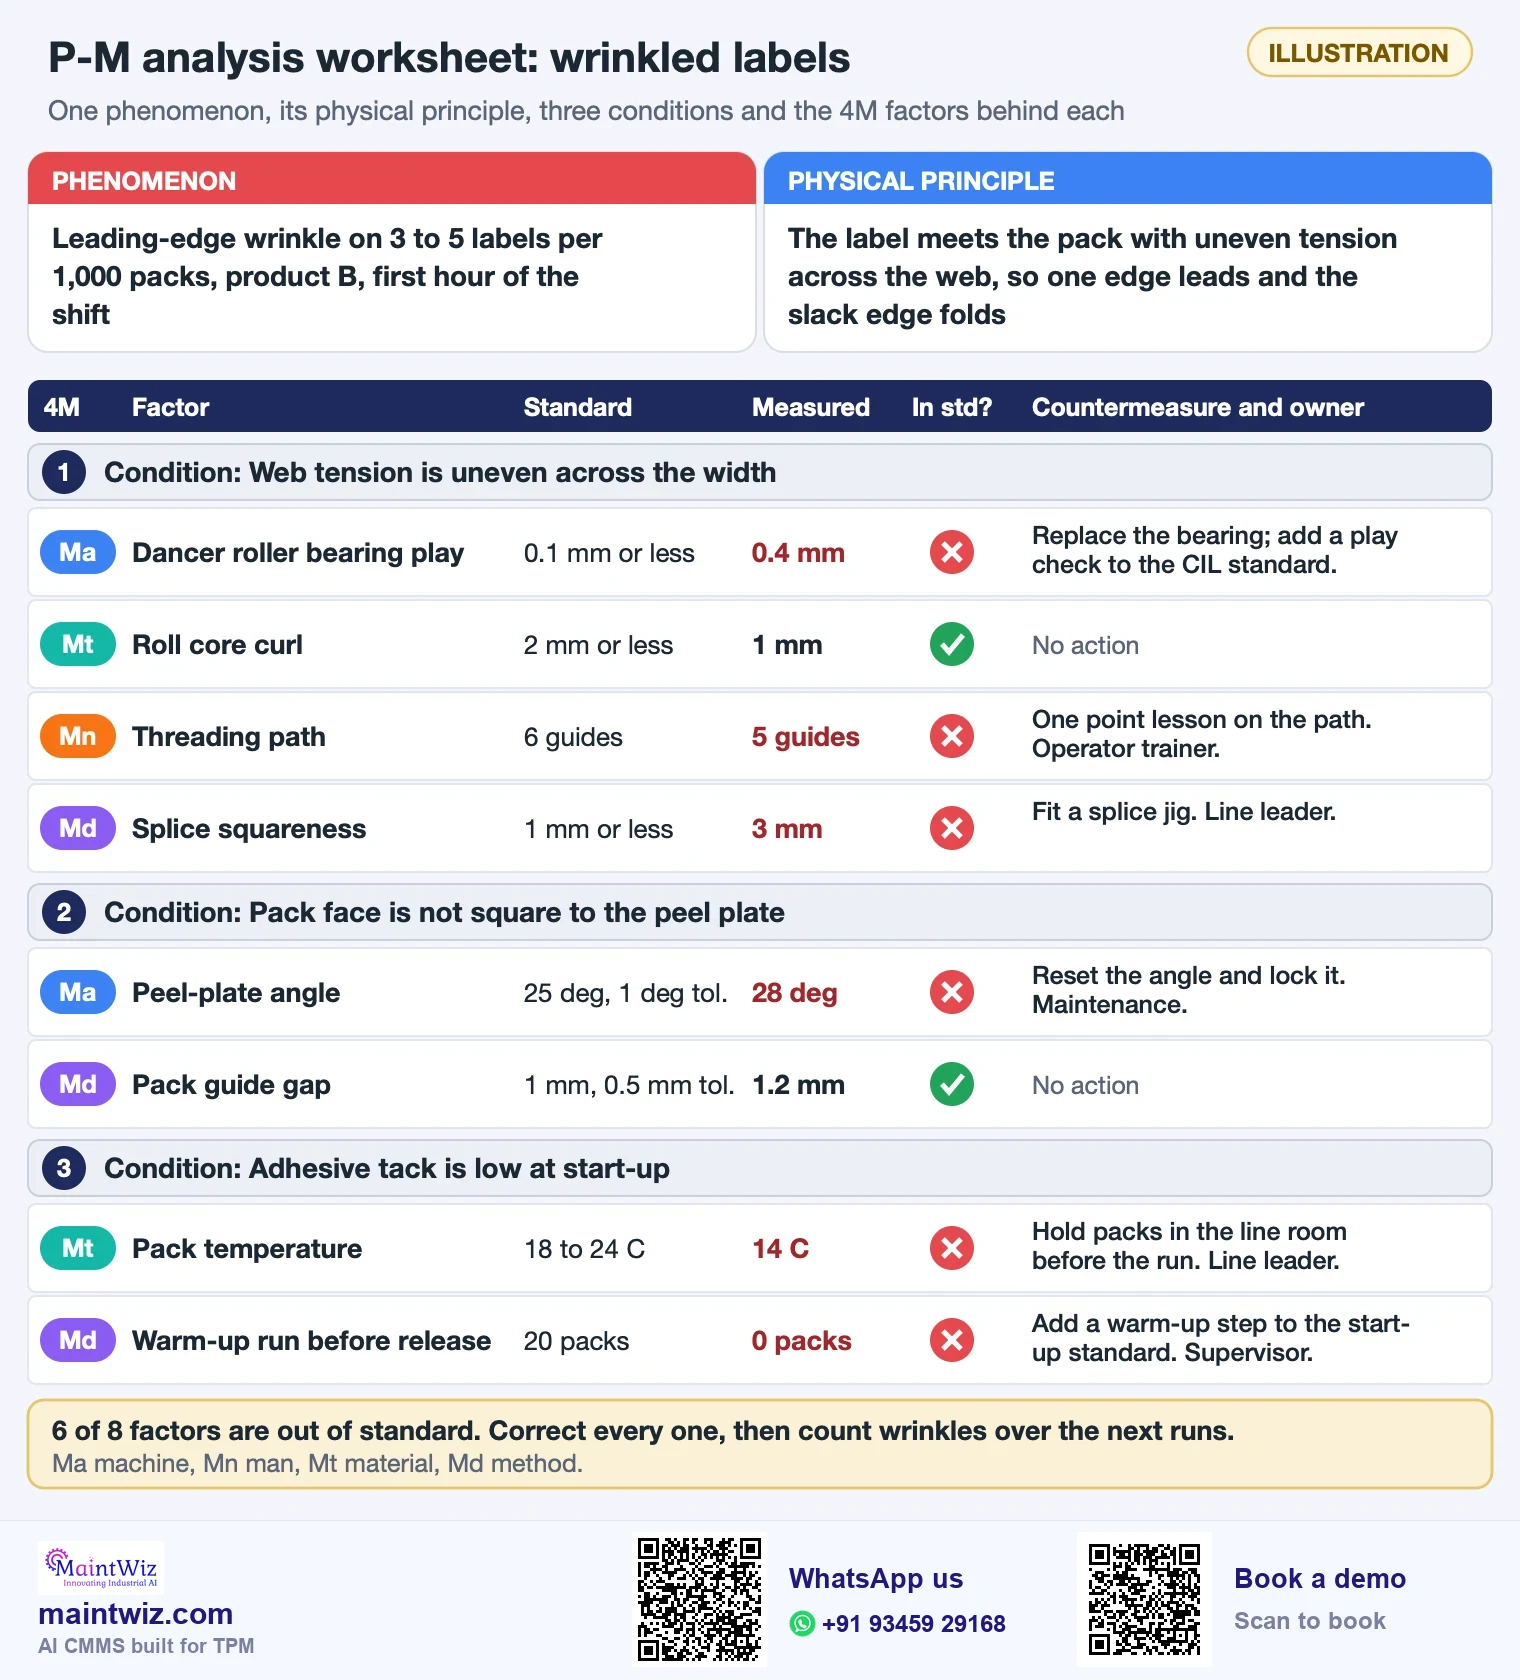
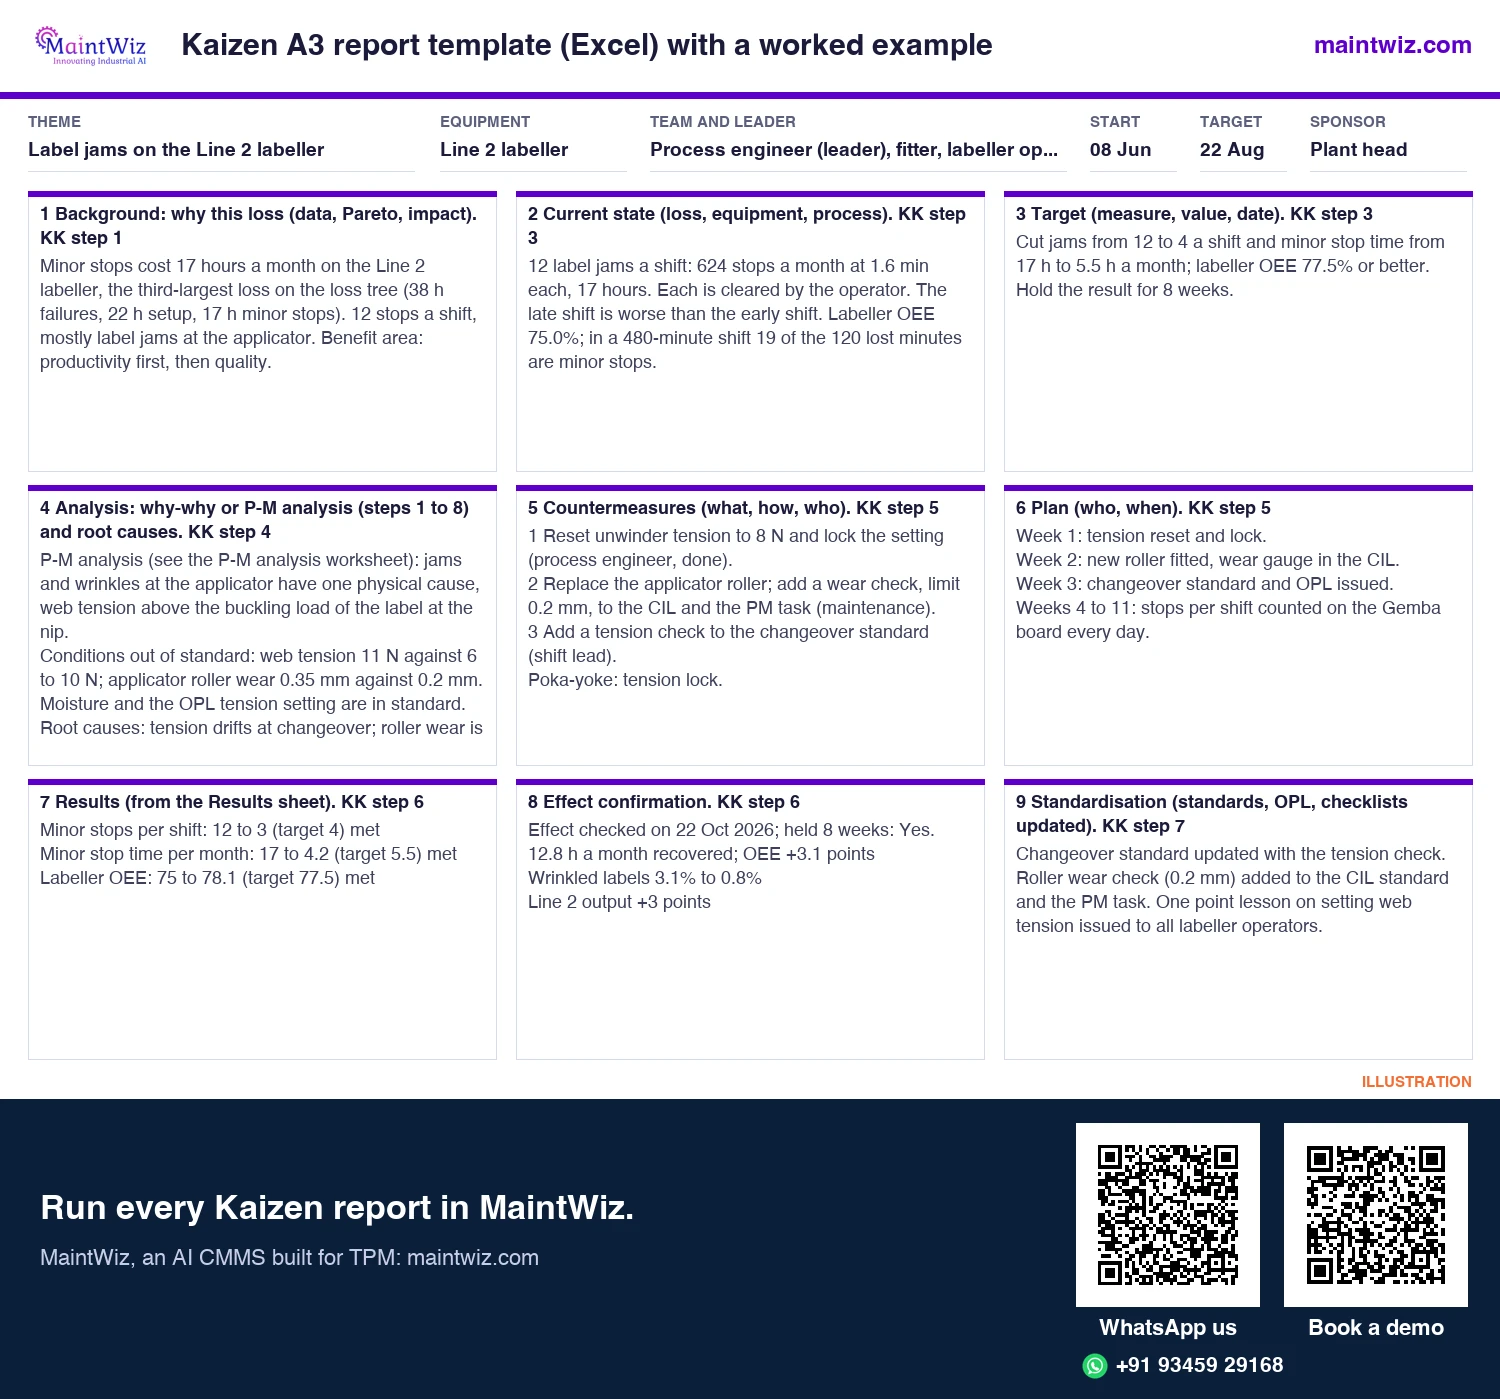
The columns fit the analysis box of the Kaizen A3 report template.
Versus other tools
How does P-M analysis differ from why-why analysis, fishbone and FMEA?
| Method | Strength | Limit | Relation to P-M analysis |
|---|---|---|---|
| Why-why (5 whys) | Fast; follows one chain of causes | Can stop at one cause; depends on the questioner | Good for sudden failures; P-M analysis lists all conditions |
| Fishbone diagram | Brainstorms causes by category | Lists possible causes without testing them | The four Ms resemble fishbone categories; P-M analysis then measures each |
| FMEA | Anticipates failure modes and effects before they occur | Is a risk assessment, not an investigation of an existing loss | Different purpose; see TPM vs RCM for related methods |
| P-M analysis | Thorough on chronic, multi-cause losses | Slow and needs measurement | Used when simpler methods have not removed the loss |
Running a P-M analysis well
- Keep the team small and cross-functional: operators who see the phenomenon, a maintenance technician, a process engineer and the project leader.
- Look at the phenomenon at the equipment; photographs and samples beat descriptions.
- Resist jumping to a cause in step 1; the value is in the list.
- Set standards for every factor before measuring, so findings are judged against something.
- Correct every out-of-standard factor, not only the largest, then watch the loss.
- Write the new standards into the CIL standard or the process standard and record where else the finding applies.
What goes wrong
What goes wrong in a P-M analysis?
- Using it for sudden failures where a simple search suffices.
- Stopping when the first cause is found and the loss drops a little.
- Listing factors without measuring them.
- Treating the four Ms as a checklist of blame.
- Not updating standards, so the factors drift again.
- No before-and-after measure on the same definition.
MaintWiz logs each correction as a Kaizen idea sheet or poka-yoke sheet in Kaizen software, beside the losses and the KK report. Book a demo with a loss from your own line, or see TPM software pricing.
FAQ
Frequently asked questions
What is P-M analysis in TPM?
P-M analysis is a method used in focused improvement for chronic losses. It describes the phenomenon, explains it by physical principles, lists the conditions and the machine, man, material and method factors behind it, and corrects each one that is out of standard.
What do P and M stand for in P-M analysis?
P stands for phenomenon and physical analysis, and M for mechanism and the four Ms of machine, man, material and method. Together they take the team from a described loss to a measured cause for every condition.
When should P-M analysis be used?
Use it for chronic losses that recur after earlier fixes and seem to have several interacting causes, such as a recurring defect or minor stop. For a sudden failure with one clear cause, a simpler method is faster.
What is the difference between P-M analysis and the 5 whys?
The 5 whys follows one chain of causes quickly and may stop at a single cause. P-M analysis lists every condition and factor that could produce the phenomenon and measures each, so it suits chronic, multi-cause problems.
What are the four Ms?
Machine, man, material and method: the groups of factors examined for each condition in P-M analysis. They resemble the categories of a fishbone diagram but are followed by measurement against standards.
Does P-M analysis need special software?
No. The analysis runs on a worksheet. MaintWiz holds what surrounds it: the loss from the Kobetsu Kaizen menu with its cost from the loss cost master, each correction as a Kaizen idea sheet or poka-yoke sheet, and the losses behind it in the KK report. Book a demo to see it on your own loss.
Where do P-M analysis results go in MaintWiz?
MaintWiz holds the records the analysis starts from: losses, production log entries, the loss cost master and the Kobetsu Kaizen report. Each correction is logged as a Kaizen idea sheet or poka-yoke sheet in the Kaizen module, and the dashboard counts Kaizens initiated, completed and cancelled.